ACC News Brief
Water Security Global
Lower emissions sharply reduce modeled spread of year-round river heatwaves
What happened
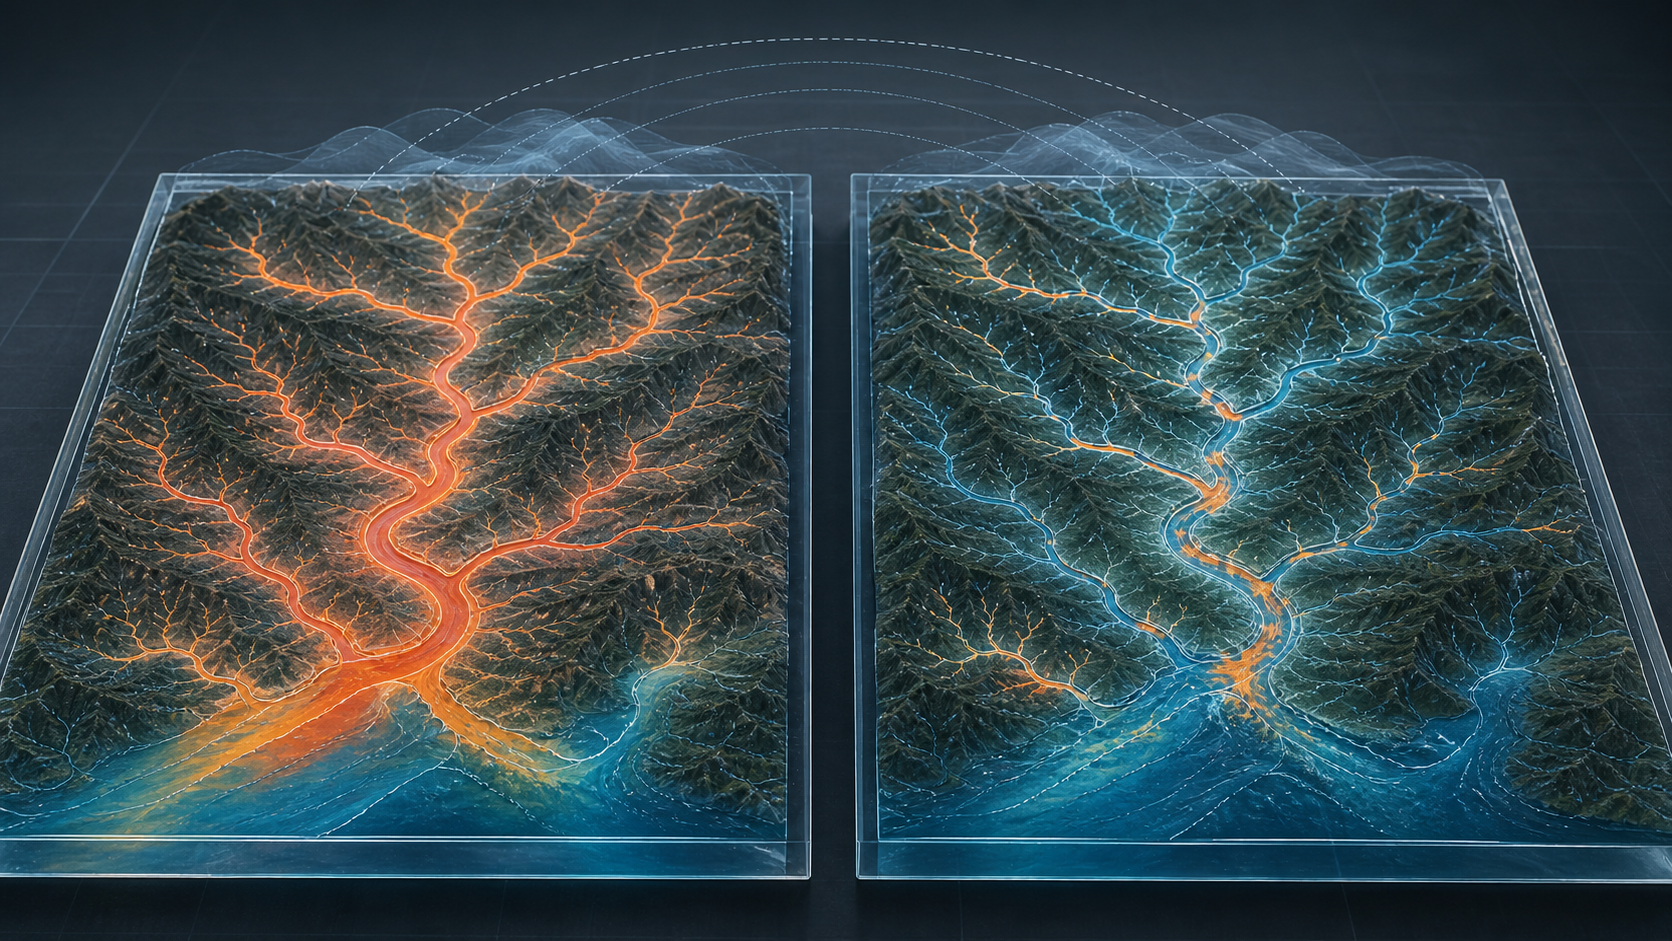
A global modeling study defined a river heatwave as weekly water temperature above each grid cell's 1976-2005 90th-percentile threshold and projected changes through 2099. For 2070-2099, 49.2% of examined rivers reached a modeled year-round heatwave state under the high-emissions RCP8.5 scenario, compared with 20.82% under RCP4.5 and 9.32% under RCP2.6. The result uses a fixed historical baseline and gridded simulations that tended to produce longer and more intense events than point observations, so it is not a precise forecast for any individual river.
Why it matters
Persistent river warming can threaten freshwater species, fisheries, drinking-water quality, irrigation, and power systems that depend on river flows or cooling. The large difference among emissions pathways shows that risk is not fixed, while local adaptation still requires finer monitoring of flow, shade, dams, withdrawals, urban heat, and ecological thresholds.
What to watch
- More in-situ river-temperature records, especially in tropical and cold regions where observations remain sparse.
- Comparisons using fixed and moving baselines, multiple hydrology models, ecological thresholds, and observed species responses.
- Faster emissions cuts plus basin-scale adaptation such as riparian shade, environmental flows, connectivity, water-quality safeguards, and heat-response plans.
Sources & evidence
- Persistent river heatwaves are emerging worldwide under climate changePeer-reviewed open-access Article in Nature Communications, published January 6, 2026. It combines historical and future modeled river temperatures across four RCPs; the authors caution that gridded simulations overestimate absolute duration and intensity relative to point observations and emphasize relative scenario changes.
- Code for the global river-heatwave analysisPublic Python code repository linked in the paper's code-availability statement. The study documents FutureStreams/E2O river-temperature data, HydroBASINS boundaries, climate classifications, and population projections as inputs.
Continue learning with ACC
Explore ACC's climate resilience guide