
This overview explains what is measured, where the indicators are improving or worsening, why scientists connect recent warming primarily to human activity, and how our choices can change future outcomes.
How the record is built
Measured in the air, ocean, ice, and physical world.
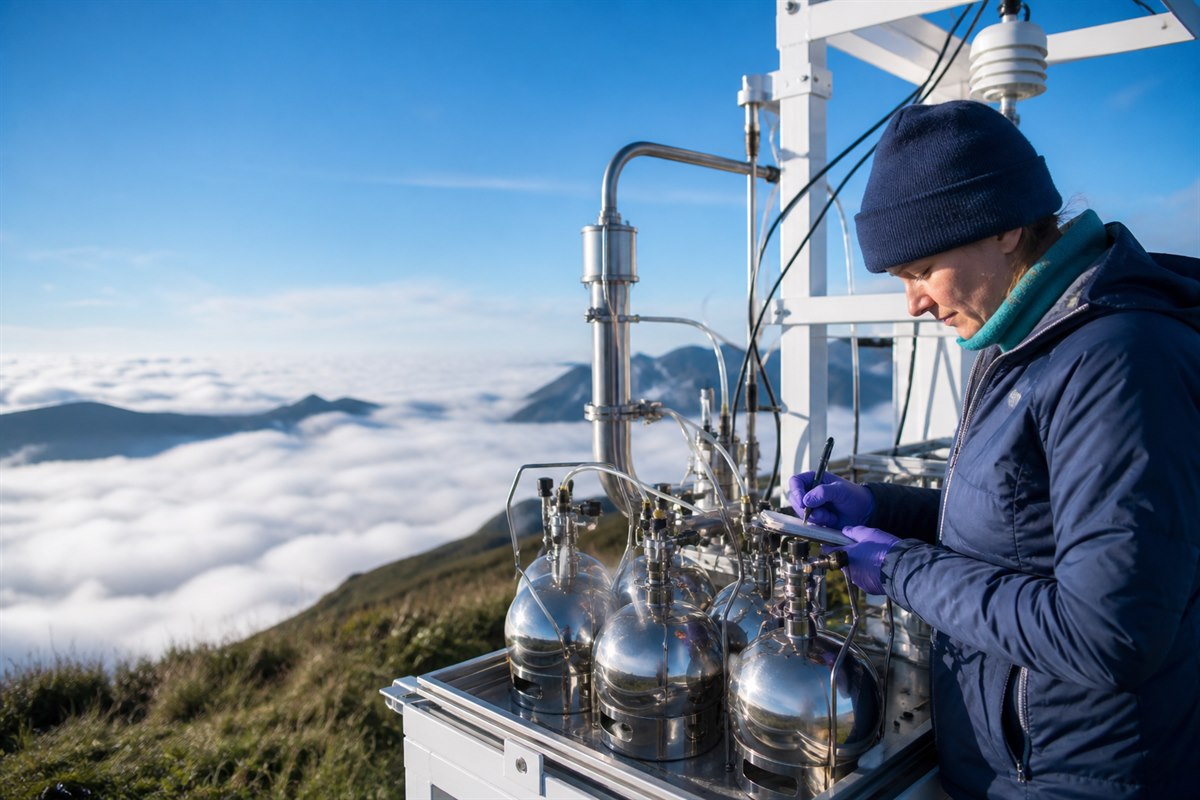
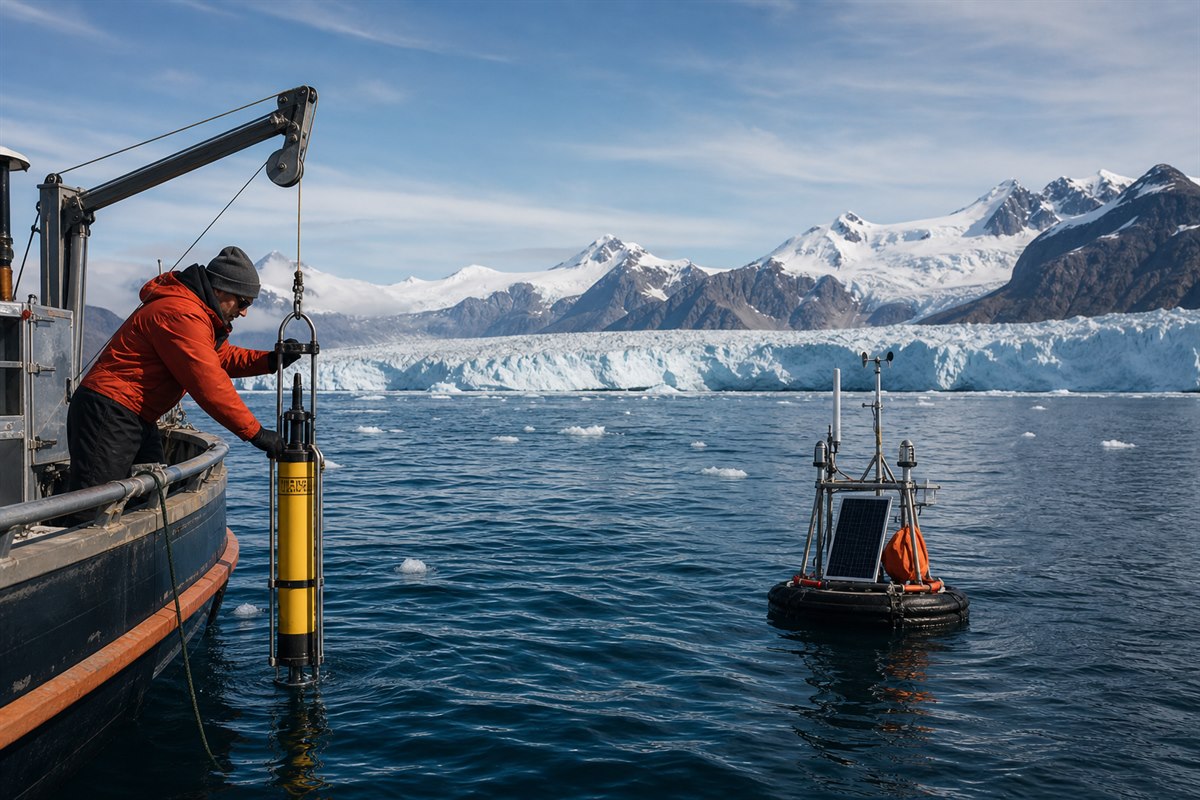
Climate evidence comes from many independent observing systems. Their agreement is what makes the overall conclusion strong.
Data Snapshot
Major climate indicators at a glance.
These figures summarize several independent lines of evidence: temperature records, greenhouse gases, ocean heat, sea level, ice, and emissions. They are not meant to replace the source reports; they are a quick data layer before the deeper explanations below.
Sources: WMO, NOAA Global Monitoring Laboratory, IPCC AR6, NSIDC, and the peer-reviewed Global Carbon Budget 2025.
Temperature
Warming compared with the 1850-1900 baseline.
The annual comparison uses WMO’s consolidated series throughout. The IPCC value is separately labeled as a ten-year average.
2011-2020: IPCC AR6 decade average. 2024 and 2025: WMO consolidated annual estimates, each with ±0.13°C uncertainty. The 2025 estimate is about 0.12°C lower than 2024.
Atmosphere
Global atmospheric CO2 was 52% above its preindustrial level in 2024.
NOAA’s globally averaged marine-surface series measured 422.80 ± 0.10 ppm in 2024, compared with a 1750 reference of about 278.3 ppm.
Source: NOAA Global Monitoring Laboratory Annual Greenhouse Gas Index. This chart intentionally uses one globally averaged series rather than mixing it with a single-station record.
Good news worth sharing
2025 was cooler than 2024—and climate progress is measurable.
On the same WMO series, 2025 was about 0.12°C cooler than 2024. That year-over-year easing is worth welcoming. WMO also explains that the shift from a strong El Niño in 2024 toward La Niña conditions contributed, so one cooler year does not by itself prove that the long-term trend reversed or that climate action alone caused the change.
There is separate, measurable progress too. The peer-reviewed Global Carbon Budget 2025 finds that during 2015-2024, 35 economies representing 27% of global fossil CO2 emissions reduced those emissions while their economies grew—nearly twice as many as in the previous decade. Global emissions still need to fall, but this is real evidence that solutions can work.
The IPCC finds that deep, rapid, and sustained emissions cuts would produce a discernible slowdown in warming within around two decades, and feasible, effective options are already available. The future is not fixed.
Evidence Table
Observed indicators and what they show.
| Indicator | What is measured | What the evidence shows | Why it matters |
|---|---|---|---|
| Surface temperature | Global land and ocean temperature records | WMO places 2024 first and 2025 second or third, with 2025 about 0.12°C cooler year over year. | Annual movement is useful context; the multi-decade record shows the climate trend. |
| Atmospheric CO2 | Parts per million in the atmosphere | NOAA measured a 2024 global annual mean of 422.80 ± 0.10 ppm, about 52% above 1750. | Measures atmospheric accumulation after land and ocean sinks remove part of human emissions. |
| Ocean heat | Heat stored in upper and deeper ocean layers | Ocean heat content reached the highest level in the 66-year observational record in 2025. | Confirms the planet is gaining energy, not merely experiencing surface-weather variability. |
| Sea level | Satellite and tide-gauge sea-level records | The average satellite-era rate rose from 2.65 mm/year in 1993-2011 to 4.75 mm/year in 2012-2025. | Raises coastal flood risk and affects long-term planning. |
| Ice and glaciers | Arctic sea ice, glaciers, snow, ice sheets | The 1979-2025 September sea-ice trend is -12.1% per decade; 2024/25 glacier balance was among the five most negative. | Independent physical evidence of warming with water-supply and coastal implications. |
| Fossil CO2 emissions | Annual carbon dioxide emissions from fossil fuels and industry | The peer-reviewed Global Carbon Budget reports 37.8 ± 1.8 billion tonnes in 2024, up 1.1% from 2023. | Tracks the largest ongoing human CO2 source; atmospheric growth also depends on land and ocean sinks. |
Cause and Confidence
Why scientists attribute recent warming mainly to human activity.
| Evidence type | Scientific meaning | Climate conclusion |
|---|---|---|
| Greenhouse-gas physics | CO2, methane, and nitrous oxide absorb outgoing infrared energy. | Adding these gases changes Earth’s energy balance. |
| Measured atmospheric chemistry | CO2 and other greenhouse gases have risen sharply since industrialization. | The cause is consistent with fossil fuels, industry, agriculture, and land-use change. |
| Pattern of warming | Lower-atmosphere and ocean warming, stratospheric cooling, ice loss, and sea-level rise align with human forcing. Ozone depletion also contributed to stratospheric change. | Solar variability alone cannot reproduce the observed modern pattern. |
| Model comparisons | Simulations with natural forcings alone do not reproduce observed modern warming; those including human and natural forcings do. | Human influence is required to explain the modern warming pattern. |
| Independent indicators | Temperature, ocean heat, ice, sea level, and ecosystems show connected changes. | The conclusion is stronger because the evidence does not depend on one measurement system. |
 Temperature data
Temperature records show long-term warming—and a welcome cooler year
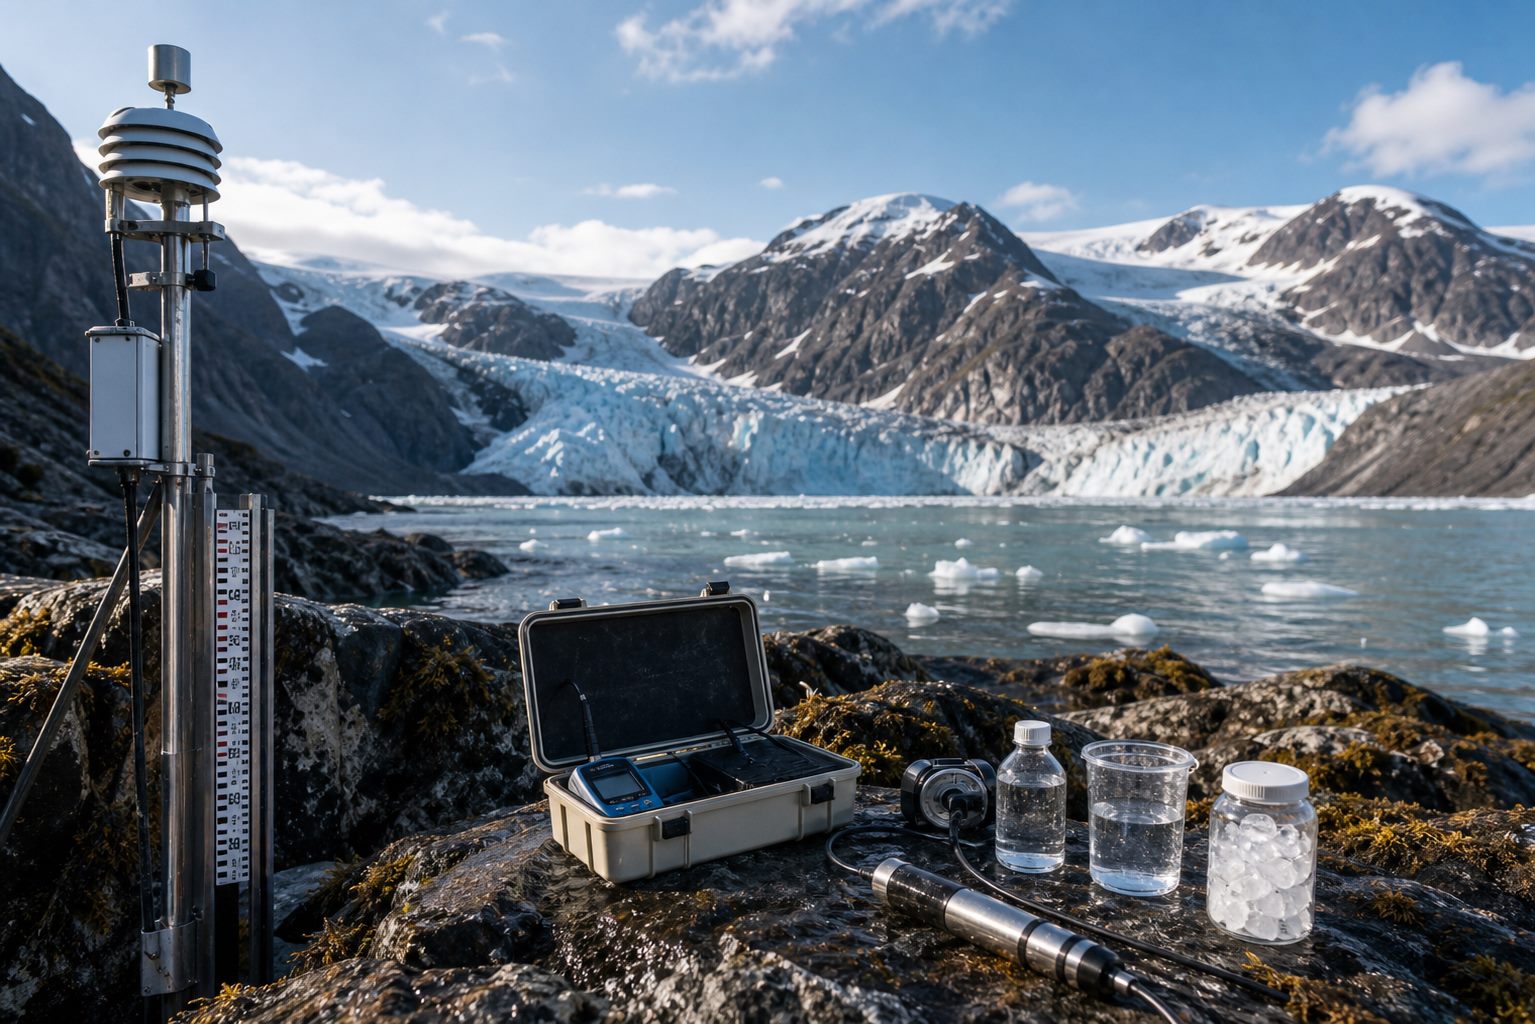
WMO reports that 2015-2025 were the eleven warmest years in the instrumental record. Using WMO’s consolidated estimates throughout, 2024 was about 1.55 ± 0.13°C above the 1850-1900 average and 2025 was about 1.43 ± 0.13°C above it.
That makes 2025 about 0.12°C cooler than record-hot 2024. The direction is welcome. WMO notes that 2024 began with a strong El Niño and that La Niña conditions contributed temporary cooling in 2025. One cooler year therefore does not establish a long-term reversal or show that climate action alone caused the change.
Sources: WMO State of the Global Climate 2025, WMO State of the Global Climate 2024, and IPCC AR6 Synthesis Report.
 Causes
Greenhouse gases explain why the planet is gaining heat
Carbon dioxide, methane, nitrous oxide, and other greenhouse gases absorb outgoing infrared energy and change Earth’s energy balance. Human activity has increased their concentrations through fossil fuel combustion, cement production, agriculture, industry, and land-use change.
NOAA’s globally averaged marine-surface CO2 concentration was 422.80 ± 0.10 ppm in 2024, about 52% above its 1750 reference. The peer-reviewed Global Carbon Budget 2025 consolidates 2024 fossil CO2 emissions at 37.8 ± 1.8 billion tonnes, up 1.1% from 2023. Observed lower-atmosphere warming and stratospheric cooling are fingerprints of human forcing; greenhouse gases drive much upper-stratospheric cooling, while ozone depletion also contributed to lower-stratospheric change.
Sources: NOAA Annual Greenhouse Gas Index, peer-reviewed Global Carbon Budget 2025, and IPCC AR6 attribution assessment.
 Ocean and ice
Oceans, sea level, glaciers, and ice show where heat is accumulating
IPCC estimates that ocean warming accounted for 91% of observed Earth-system energy gain during 1971-2018. WMO reports that ocean heat content then reached the highest level in its 66-year observational record in 2025; the 2005-2025 warming rate was more than twice the 1960-2005 rate.
Global mean sea level has risen throughout the satellite era. Its average rate was 4.75 mm per year during 2012-2025, compared with 2.65 mm per year during 1993-2011. NSIDC reports a 12.1% per-decade decline in September Arctic sea-ice minimum extent over 1979-2025, and WMO places the 2024/25 reference-glacier balance among the five most negative on record.
Sources: WMO State of the Global Climate 2025, IPCC AR6 ocean assessment, and NSIDC 2025 sea-ice analysis.
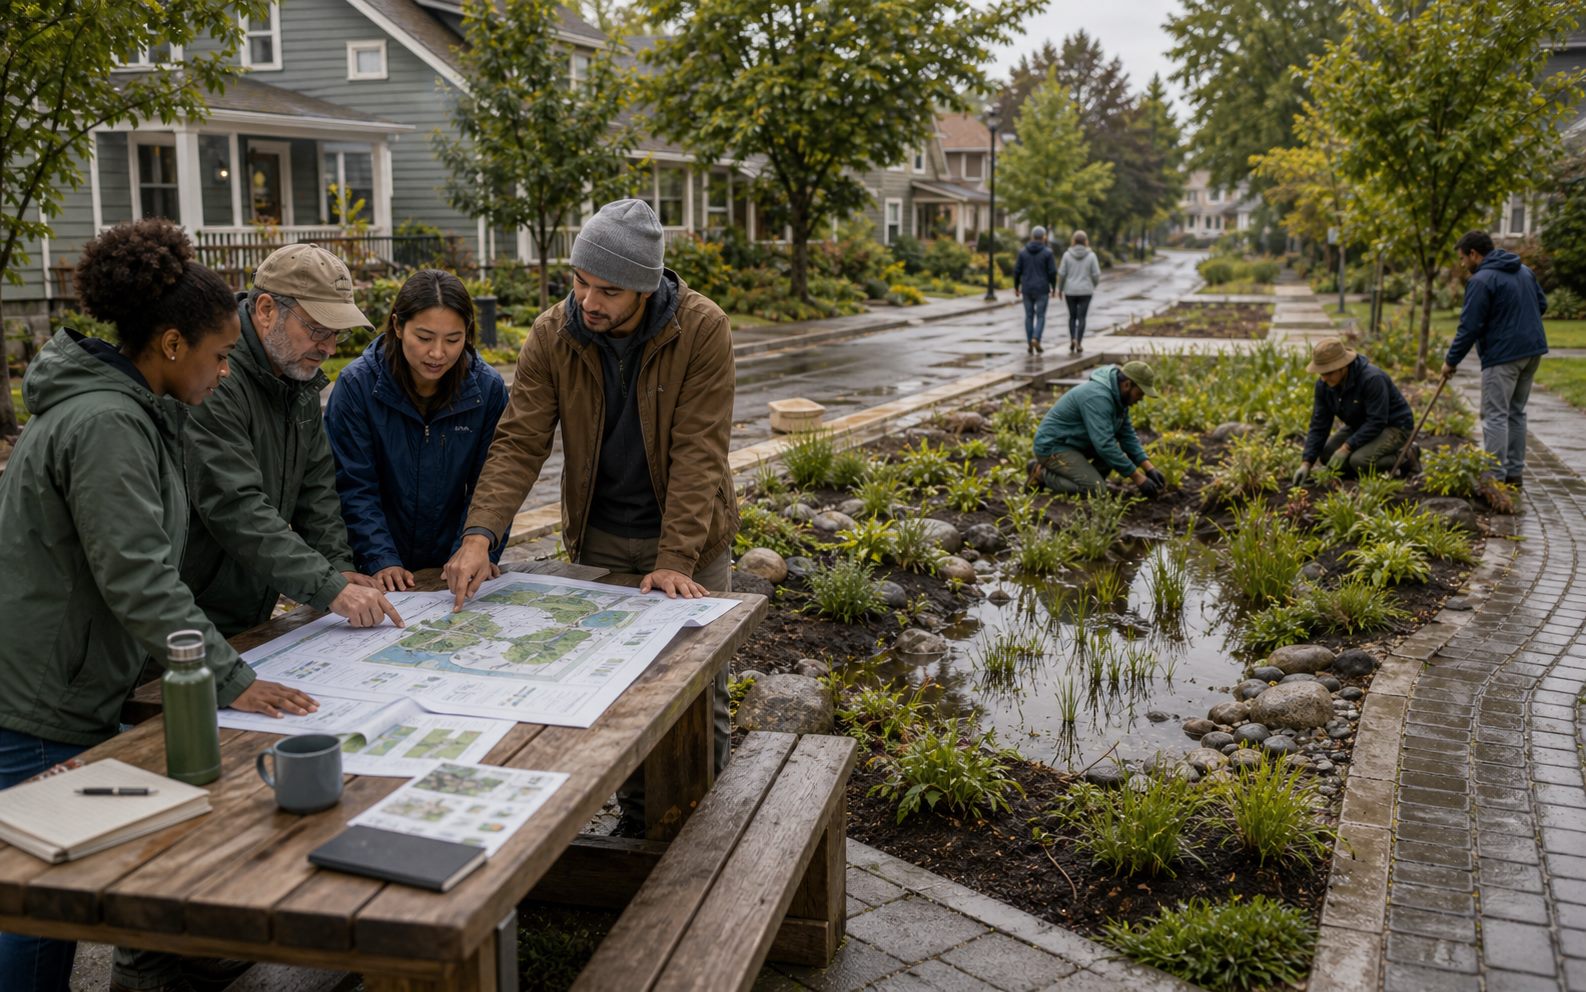 Weather evidence
Weather evidence is strongest when every claim is specific
Climate change does not mean every storm, fire, flood, or drought has a single cause. It changes the background conditions in which events happen. Higher baseline temperatures make heat extremes more likely and intense across most land regions, while a warmer atmosphere can hold more water vapor and raise heavy-rainfall potential in many settings.
Attribution studies compare an event in today’s climate with a modeled world without the same human influence. Confidence varies by hazard and region. Damage also depends on exposure, vulnerability, land use, infrastructure, water management, and preparedness—which means better planning and resilience can reduce harm.
Sources: IPCC AR6 Working Group I, IPCC AR6 Working Group II, and WMO State of the Global Climate 2025.

Drought evidence • Shareable explainer
How human-caused climate change can make drought more likely and severe
The strongest scientific conclusion is precise: human-caused climate change has increased the likelihood or severity of drought in many regions, especially agricultural, ecological, and hydrological drought. It does not mean that warming single-handedly causes every drought or that every region is becoming drier.
- Claim verdict
- Supported with caveats
- Confidence
- High when bounded by drought type and region
- Evidence reviewed
- August 23, 2026
Start with the definition
Drought is not one measurement
Scientists separate drought into types because each one can have different causes and trends. A rainfall deficit can begin a drought, while heat, soil conditions, water use, and management can determine how deeply it affects farms, ecosystems, rivers, reservoirs, and communities.
- Meteorological
- A sustained precipitation deficit for a place and season.
- Agricultural and ecological
- Unusually low soil moisture or plant water stress.
- Hydrological
- Low streamflow, groundwater, reservoirs, or other stored water.
- Snow drought
- Unusually low snow-water storage, caused by limited precipitation, warmth, or both.
Definition source: IPCC AR6 Working Group I, Chapter 11, Section 11.6. Snow-drought context: Marshall et al., PNAS (2026).
The physical chain
Warming can turn a dry period into a deeper water shortage
- Greenhouse gases retain more heat.Human emissions warm the atmosphere and land surface.
- Warmer air raises evaporative demand.The atmosphere can draw more moisture from soils, water, and vegetation.
- Soils and plants lose water faster.When rainfall is limited, greater evaporation and plant water loss can deepen agricultural and ecological drought.
- Water storage can shrink or arrive earlier.Warm winters can reduce snow storage and shift runoff timing, while rainfall and circulation changes can intensify dry conditions in some regions.
This mechanism is why drought can worsen even when precipitation is not record-low. The effect depends on season, location, soils, vegetation, snowpack, and existing water demand.
Mechanism source: IPCC AR6 Working Group I, Chapter 11, Sections 11.6.2 and 11.6.4.
What the evidence shows
Three layers of proof point in the same direction
Human influence is already visible
The IPCC concludes with high confidence that high-impact droughts have become more likely or more severe because of human-caused climate change. It also reports more frequent and severe drought in some places, while emphasizing that regional patterns differ.
IPCC AR6 Working Group II, Chapter 4 →More warming increases drought pressure
The IPCC projects that agricultural and ecological drought will become more frequent or intense in some regions as global warming increases. It also finds that the severity of wet and dry events grows as the global water cycle intensifies.
IPCC AR6 Working Group I, Summary for Policymakers B.2-B.3 →About 4.4 times as likely
A 2026 attribution study estimated that a western U.S. snow drought as severe as that spring's event was about 4.4 times as likely in the current climate as in the preindustrial climate. The reported 95% confidence interval was 2.6 to 9.4.
Marshall et al., PNAS, published July 20, 2026 →How to read the 4.4× estimate: it applies to one defined 2026 western U.S. snow-drought event and metric. It is evidence that climate change altered this event's probability, not a global multiplier for every drought.
Primary assessments and study
Sources behind this conclusion
- IPCC AR6 Working Group II, Chapter 4: Water (2022)Executive Summary and Sections 4.2.1-4.2.5: observed hydrological change, drought attribution, impacts, and confidence.
- IPCC AR6 Working Group I, Summary for Policymakers (2021)Sections A.3 and B.2-B.3: observed extremes, attribution, and how drought risk changes with additional warming.
- IPCC AR6 Working Group I, Chapter 11 (2021)Section 11.6: drought definitions, mechanisms, observed trends, detection and attribution, and projections.
- Marshall et al., Proceedings of the National Academy of Sciences (2026)Peer-reviewed attribution study of the 2026 western U.S. snow drought, including uncertainty.
 Choices and outcomes
Projections show that our choices change outcomes
Climate projections are conditional scenarios, not declarations that one future is guaranteed. Higher cumulative emissions generally mean more warming and greater pressure on people and ecosystems. Lower emissions and stronger preparedness improve the range of possible outcomes. The future is not fixed.
The IPCC finds that deep, rapid, and sustained emissions reductions would create a discernible slowdown in global warming within around two decades and measurable atmospheric changes within a few years. It also finds that feasible, effective, and low-cost mitigation and adaptation options are already available.
Source: IPCC AR6 Synthesis Report, Summary for Policymakers.
 Confidence
The evidence is strong because independent indicators agree
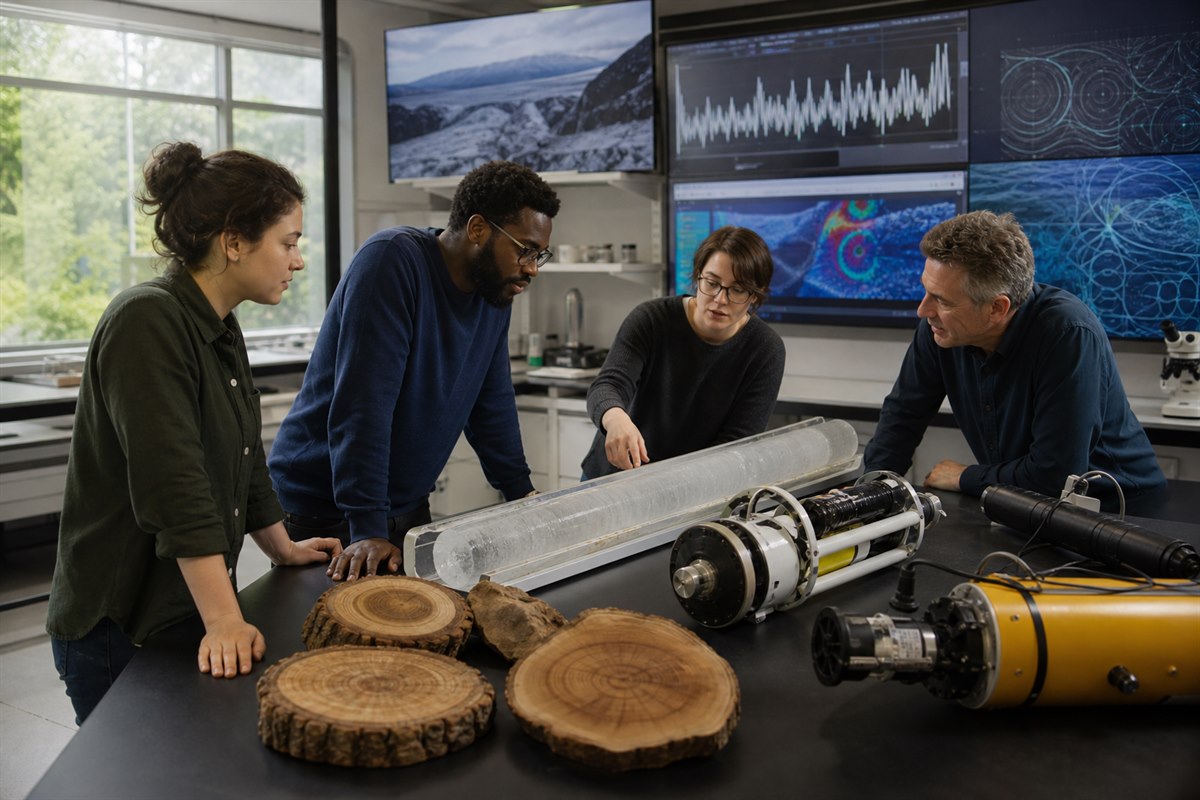
The scientific conclusion does not rest on a single quote or graph. It comes from partly independent lines of evidence: thermometer records, ocean heat, satellite observations, glacier measurements, sea level, atmospheric chemistry, physical theory, and experiments comparing human and natural forcing.
Scientific confidence still varies by question, especially for local impacts. The central conclusions are robust: the planet has warmed, human-added greenhouse gases are the dominant cause of recent warming, impacts are observable, and future outcomes depend heavily on emissions and preparedness.
Sources: IPCC AR6 Synthesis Report, IPCC AR6 Working Group I, and WMO State of the Global Climate 2025.
ACC takeaway
The fight is not lost. Progress is real, and action can build on it.
It is good news that 2025 was cooler than 2024, and it is good news that more economies are cutting fossil emissions while growing. Neither result means the work is finished. The strongest reason for optimism is that sustained emissions cuts can slow warming, practical options already exist, and ordinary people can help make them easier to adopt.
Start small: follow a step in the Sustainable Living Guide, support well-vetted climate work, or help someone else find a practical solution. No single action has to carry the whole problem. Consistent action adds up and helps create the conditions for larger change.
References & further reading
Review the underlying data.
- WMO: State of the Global Climate 2025Consolidated temperature, ocean heat, sea level, glaciers, and other 2025 indicators.
- WMO: State of the Global Climate 2024Consolidated 2024 climate indicators, including the 1.55°C annual temperature estimate.
- IPCC AR6 Synthesis ReportAssessed warming, causes, impacts, adaptation, mitigation, and how action changes outcomes.
- IPCC AR6 Working Group IPhysical science basis for observations, attribution, oceans, and projections.
- IPCC AR6 Working Group II, Chapter 4: WaterObserved and projected drought risk, hydrological impacts, attribution, and adaptation.
- IPCC AR6 Working Group I, Chapter 11: Weather and Climate ExtremesDrought definitions, mechanisms, regional attribution, and projections.
- Marshall et al., PNAS: 2026 western U.S. snow droughtPeer-reviewed event attribution with a west-wide risk ratio and reported uncertainty.
- NOAA Annual Greenhouse Gas IndexGlobally averaged greenhouse-gas measurements and the 2024 CO2 annual mean.
- Global Carbon Budget 2025, Earth System Science DataPeer-reviewed fossil-emissions estimates, carbon sinks, and measured economic decarbonization.
- NSIDC: 2025 Arctic sea-ice minimumCurrent September sea-ice trend and 2025 minimum context.