
ACC News Brief
Climate Data Global
New global maps show cooling needs rising fastest before 2°C
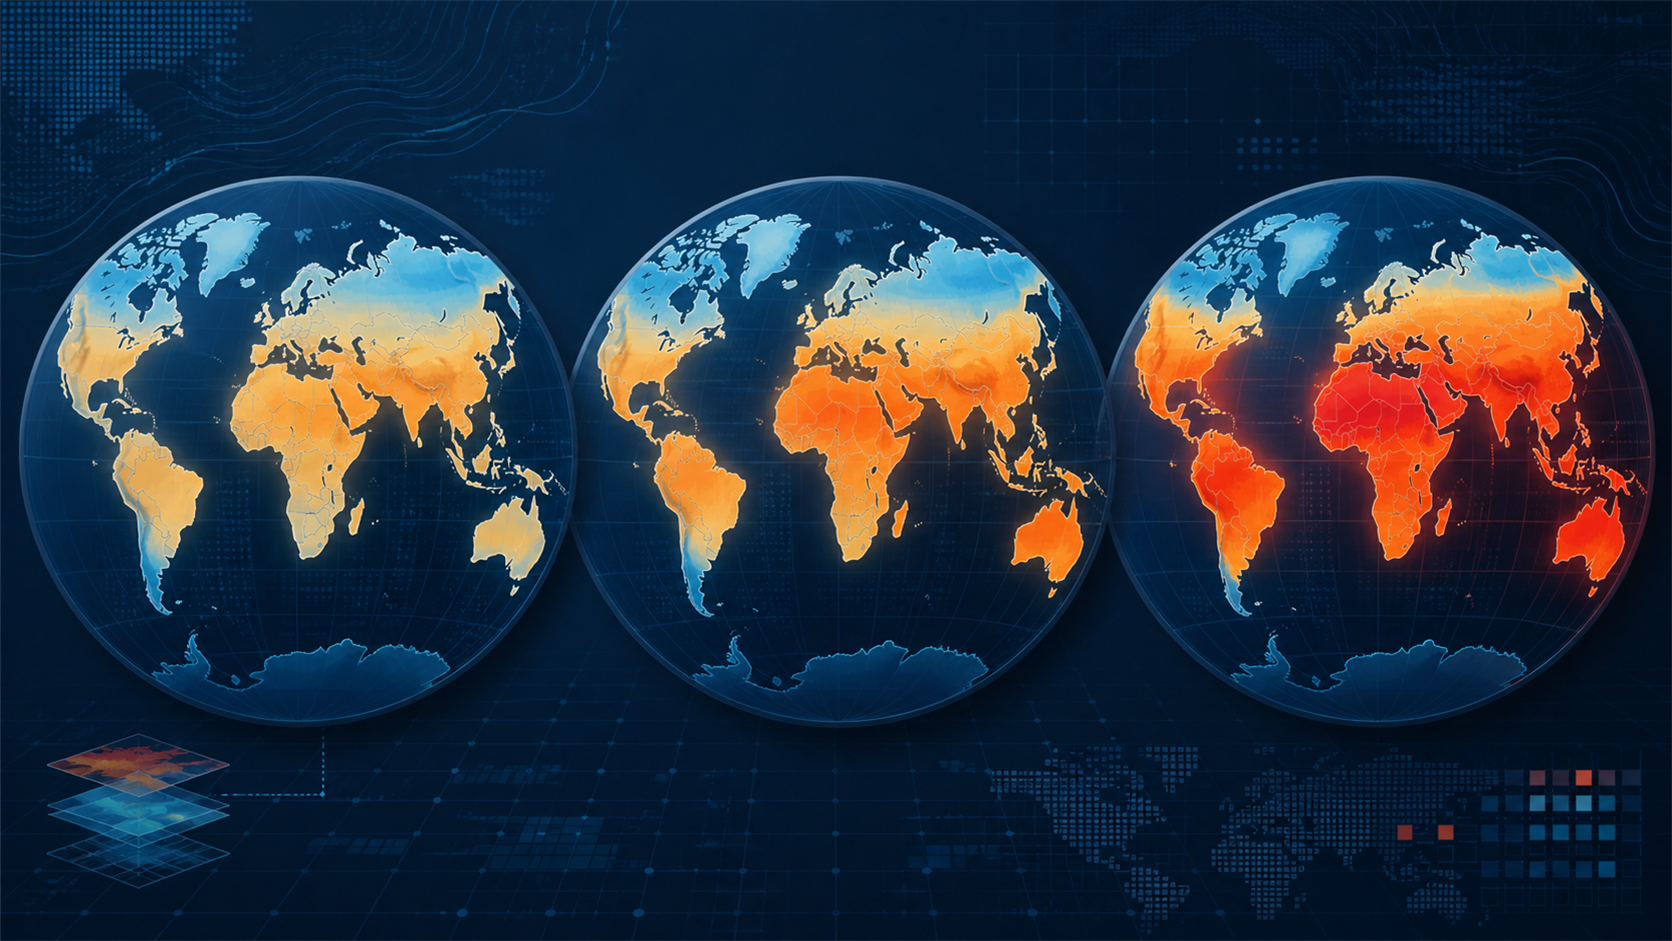
What happened
Researchers released 30 global maps of heating- and cooling-degree days at 1°C, 1.5°C, and 2°C warming levels. Under SSP2-4.5 population assumptions, the share of people living where annual cooling-degree days exceed 3,000 rises from 23%, or 1.54 billion people, in 2010 to 41%, or 3.79 billion, by 2050 if warming reaches 2°C.
Why it matters
The open dataset can help planners anticipate where efficient cooling, resilient buildings, and clean electricity may be needed most. Degree days are temperature-based demand indicators, however, not direct forecasts of electricity use, health outcomes, or access to cooling.
What to watch
- Use of the dataset in building standards, public-health plans, and electricity-grid investment.
- More detailed modeling that includes humidity, cities, building quality, behavior, affordability, and peak demand.
- Deployment of efficient cooling, passive design, shade, and low-global-warming-potential refrigerants.
Sources & evidence
- Global gridded dataset of heating and cooling degree days under climate change scenariosPeer-reviewed Resource in Nature Sustainability, published January 26, 2026. It provides open modeled maps for three global-warming levels; degree days are planning proxies rather than observed energy consumption, cooling access, or health effects.
Continue learning with ACC
Explore ACC's buildings and transportation guide