ACC News Brief
Clean Energy Australia
Official quarterly inventory estimate - sector results are mixed and estimates may be revised
Renewables helped lower Australia's electricity emissions
What happened
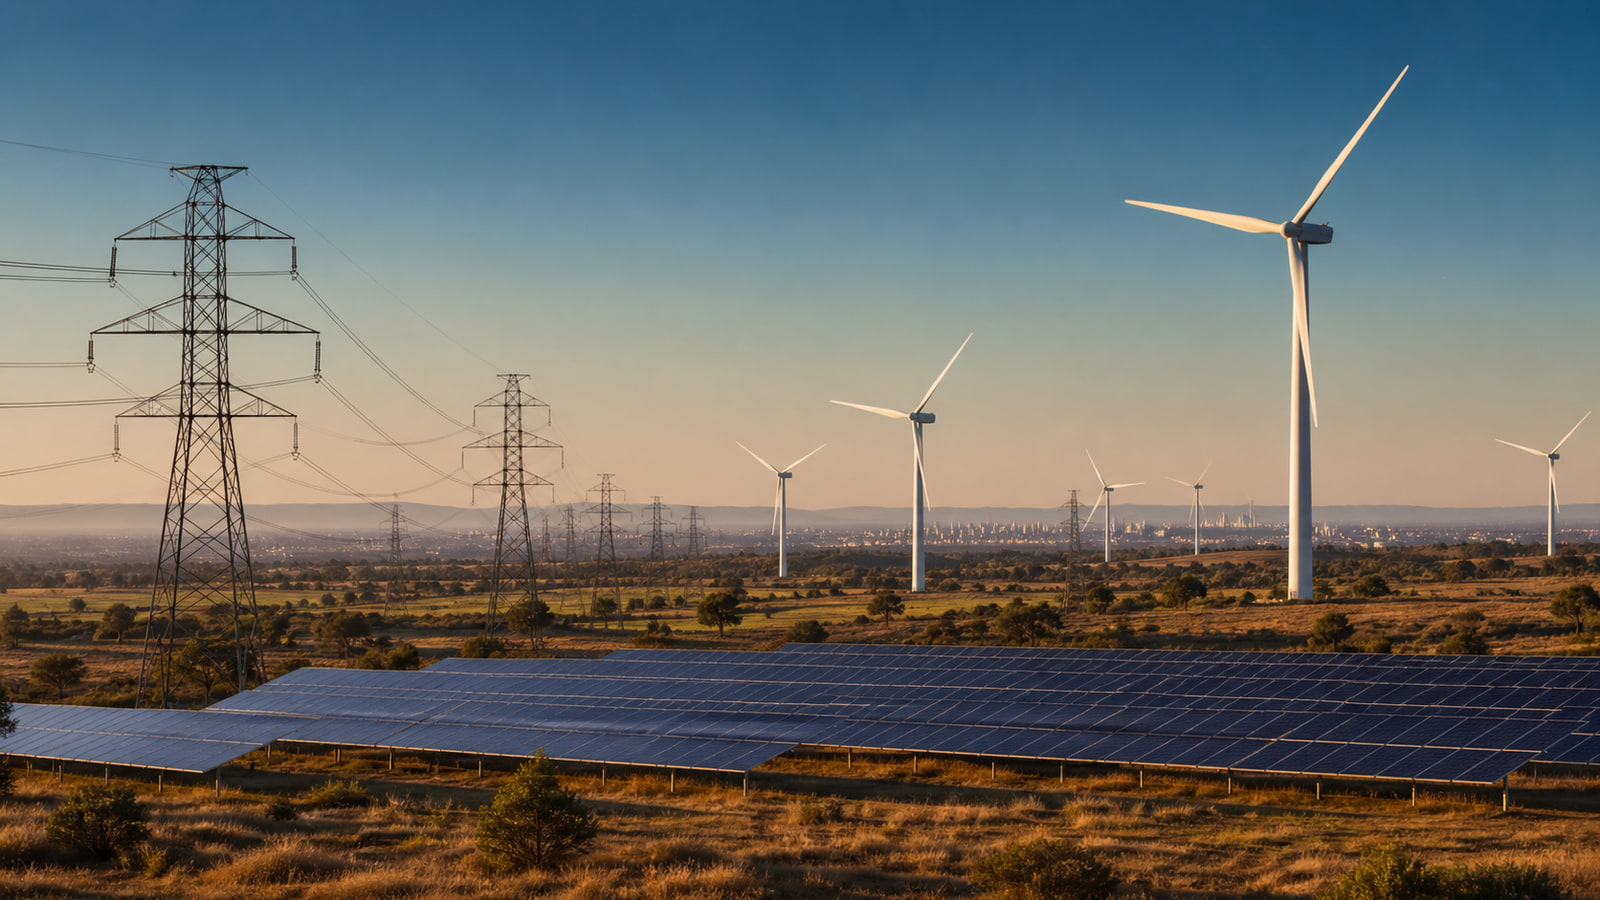
Australia's official quarterly greenhouse-gas inventory estimates 455.6 million tonnes of emissions for the year through March 2026, down 7.5 million tonnes, or 1.6 percent, from the prior year. Electricity-sector emissions fell 5.6 million tonnes, or 3.7 percent, as renewable generation displaced more coal and gas. Transport emissions rose 0.2 percent, however, so the national result is a mixed sector-by-sector picture rather than an across-the-board decline.
ACC context
Australia's total was estimated at about 25 percent below 2005 levels, but progress toward future targets depends on more than electricity. ACC treats the inventory as an official accounting estimate, not proof that every policy is working or that the country is yet on track for its 2030 goal.
Why it matters
The update shows how cleaner electricity can move a national emissions total even while harder-to-decarbonize sectors lag. It also illustrates why a single national percentage is not enough: electricity progress, transport demand, industrial activity, and inventory revisions all need to be tracked separately.
What to watch
- Revisions when Australia publishes later quarterly and annual inventory estimates.
- Whether renewable generation, storage, transmission, and coal retirements keep electricity emissions falling without reliability setbacks.
- Whether road freight, aviation, and other transport sources reverse their recent increase.
Sources & evidence
- Renewables continue to lower Australia's emissionsAustralian Minister for Climate Change and Energy release dated August 28, 2026, summarizing the latest quarterly inventory and sector changes.
- National Greenhouse Gas Inventory Quarterly Update: March 2026Official inventory source for the year through March 2026. Quarterly estimates can be revised as source data and methods are updated.
Continue learning with ACC
Explore how renewable generation, storage, and transmission work together