ACC News Brief
Oceans & Water Southern Ocean
Southern Ocean phytoplankton show opposite regional patterns during temperature extremes
What happened
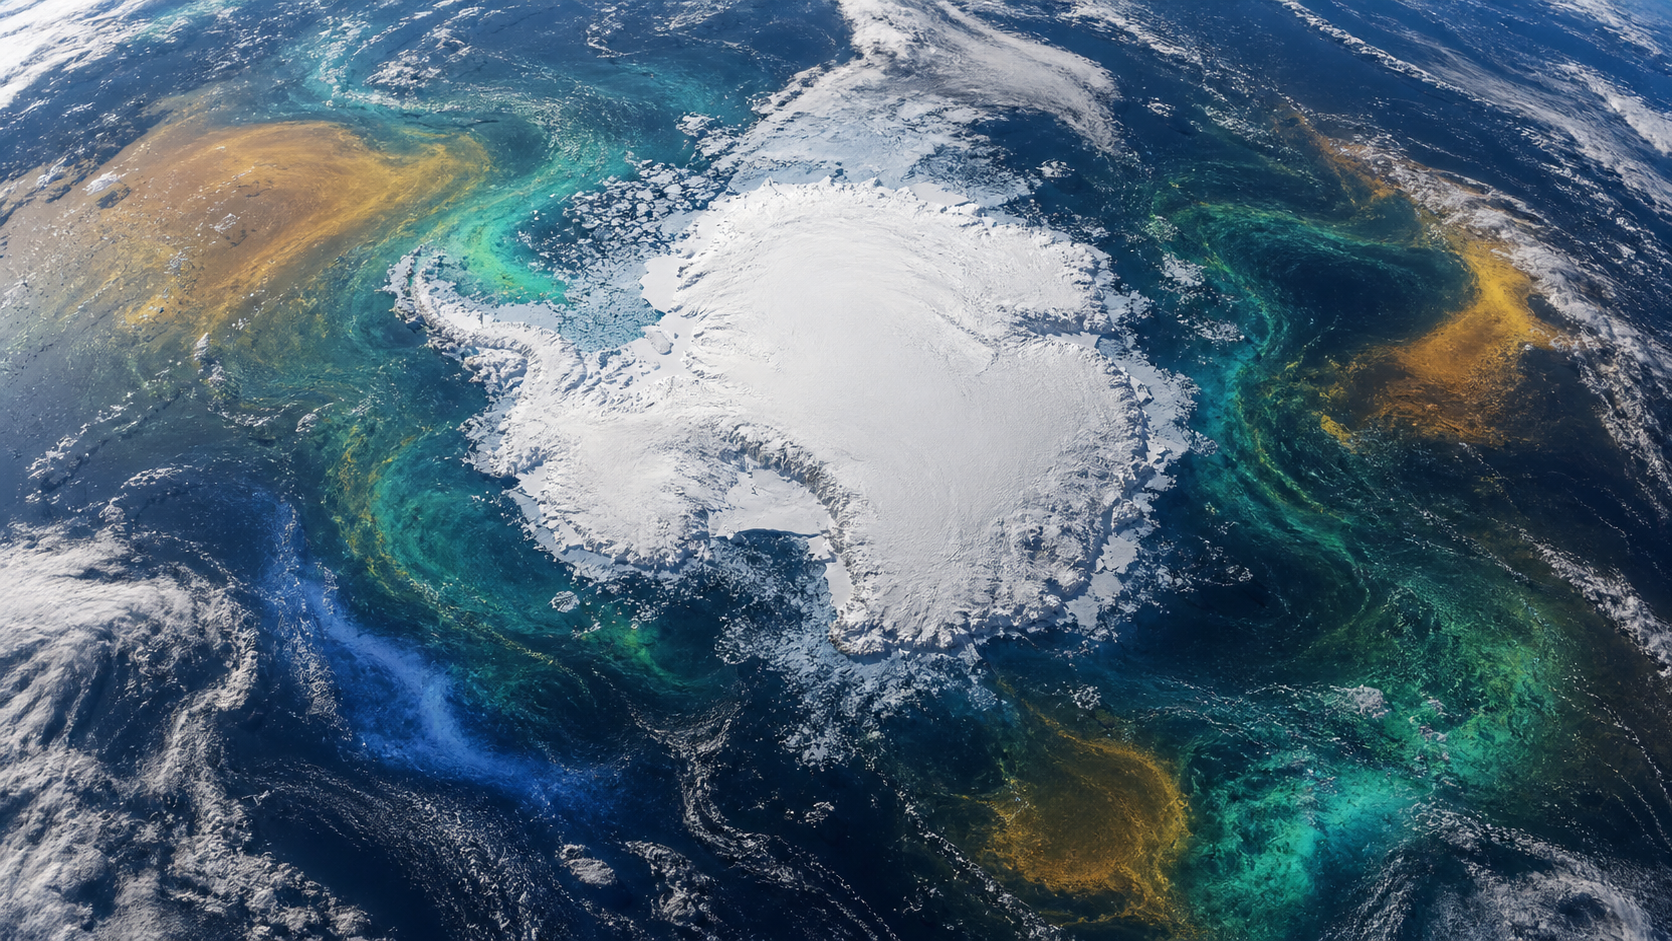
An analysis of satellite-derived conditions from 1998 through 2023 found strongly regional phytoplankton responses to marine heatwaves and cold spells. Heatwaves were associated with 21.11% lower chlorophyll-a in the subtropical zone but 22.26% higher chlorophyll-a in the Sub-Antarctic Zone, while cold spells produced broadly opposite patterns; these are observational, surface-ocean associations shaped by light, nutrients, mixing, and food-web processes, not proof of one uniform response around Antarctica.
Why it matters
Southern Ocean phytoplankton support marine food webs and influence carbon and nutrient cycling. Regional shifts in their abundance and size structure can change ecosystem productivity and carbon-cycle feedbacks, making both heat and cold extremes important for monitoring and planning.
What to watch
- Longer satellite and in-water records that track event duration, season, depth, species composition, grazing, nutrients, and carbon export.
- Whether Earth-system models reproduce the opposite regional responses to marine heatwaves and cold spells.
- Consequences for krill, fisheries, higher predators, biogeochemical cycling, and protected-area management as temperature extremes change.
Sources & evidence
- Extreme temperature events reshuffle the ecological landscape of the Southern OceanPeer-reviewed open-access Article in Nature Communications, published December 30, 2025, DOI 10.1038/s41467-025-68029-0; led by Sun Yat-sen University with Southern Marine Science and Engineering Guangdong Laboratory and University of Exeter collaborators. It analyzes satellite products, reanalysis, floats, and pigment observations; the reported chlorophyll patterns are regional associations and do not directly measure every ecological or carbon-export outcome.
- Figure data for the Southern Ocean temperature-extremes studyFigshare record linked by the paper for data used to generate the study figures; the authors also released main analysis code at Zenodo DOI 10.5281/zenodo.17223292.
Continue learning with ACC
Explore ACC's ecosystems and biodiversity guide