Precise proposition checked
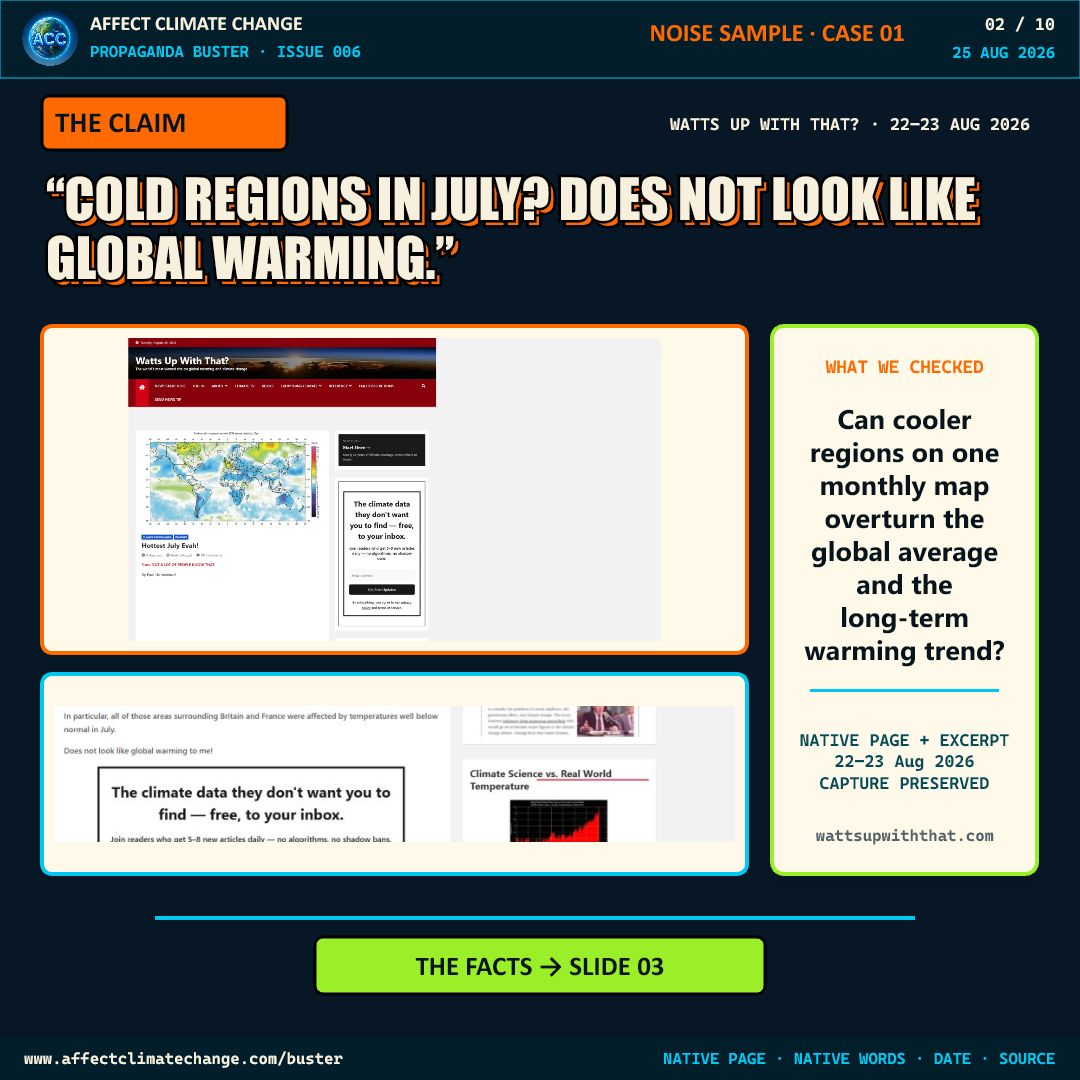
Regional cool anomalies on a single monthly temperature map demonstrate that the global average and long-term human-caused warming trend are not occurring.
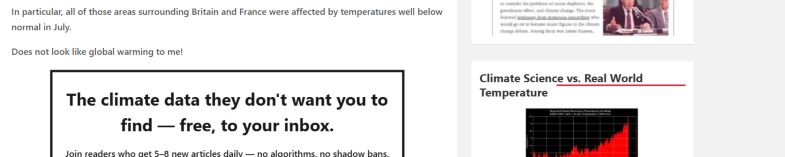
Full post context: A Watts Up With That? article dated August 22 in its URL and August 23 in UTC page metadata highlighted cooler July 2026 regions to imply global warming was not occurring.
Scope of this check: The check accepts that several regions were cooler than their July average. It separates regional anomalies, the global monthly mean, and the long-term trend.
What the evidence shows
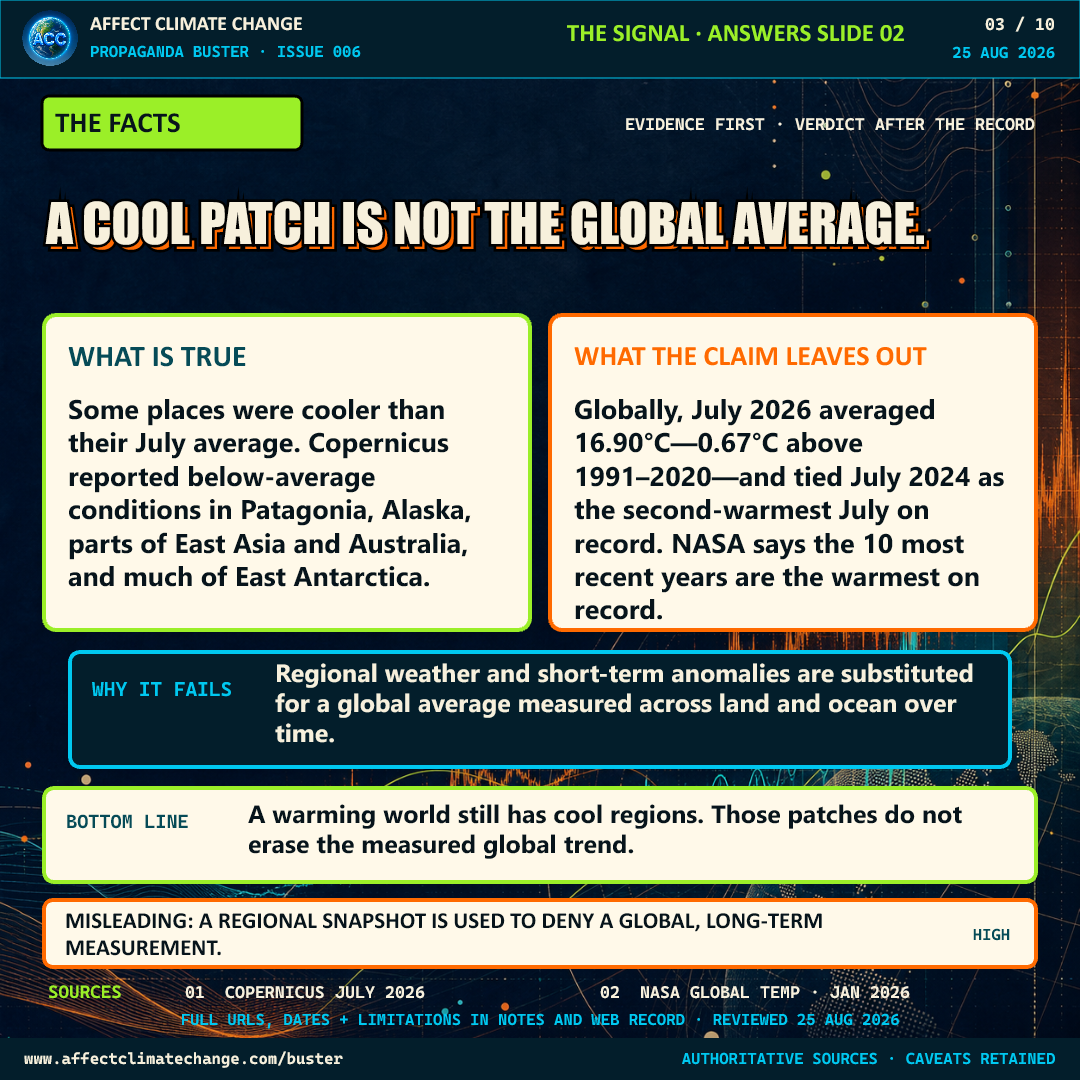
Copernicus measured July 2026 at 16.90°C globally, 0.67°C above the 1991–2020 July average, tying July 2024 as the second-warmest July on record. NASA's annual record independently shows that the ten most recent years are the warmest on record.
- Cool regional anomalies were present in July 2026.
- The Copernicus global July average was 16.90°C, 0.67°C above the 1991–2020 July average.
- July 2026 tied July 2024 as the second-warmest July in that dataset.
- NASA's annual record shows the ten most recent years are the warmest on record.
Evidence chain
Each source is dated and paired with the finding it supports. The original post establishes what was claimed; it does not decide the scientific verdict.
Surface air temperature for July 2026
Published / source period: 2026-07 bulletin
Copernicus Climate Change Service · Global July average 16.90 C; 0.67 C above 1991-2020; joint-second-warmest July. Regional cold anomalies also existed.
Accessed August 25, 2026
Global Temperature - Earth Indicator
Published / source period: 2026-01-21
NASA Science · The 10 most recent years are the warmest on record; NASA combines land and ocean observations.
Accessed August 25, 2026
What is true
Some regions, including parts of Europe and other areas shown on the map, were cooler than their July climatology. Neither one warm nor one cool month establishes a long-term trend by itself.
Where the claim fails
The argument substitutes selected regions for the area-weighted global average and substitutes one month for the long-term record. A warming climate still contains cooler-than-average places and short-term regional variability.
Limits and uncertainty
A single global month is not the long-term trend. Dataset methods and reference periods differ slightly, while the broad conclusion is tested across independent records.
Assessment after the evidence
Regional cold anomalies can occur during a very warm global month; they do not overturn the measured global average or long-term trend.
How the framing works
Spatial cherry-picking and weather-versus-climate confusion: cool patches are substituted for the global mean and long record.
How scientists know
Climate centers combine quality-controlled land and ocean observations on a global grid, calculate area-weighted monthly averages against a defined reference period, and evaluate the multi-decade record separately.
Editorial boundaries
ACC evaluates the claim. It does not infer intent, coordination, funding, deception, or control without direct evidence specific to that attribution.
The source presentation and reuse decision are documented here: Approved bounded native-source crop for criticism and fact-checking, shown with attribution and a direct source link; unrelated page content is excluded.
Corrections and revision record
Corrections status: No change to the scientific verdict has been recorded.
v1.0 · August 25, 2026
Initial evidence review. Verdict: MISLEADING, high confidence; source-date variance retained.
v1.1 · August 28, 2026
Canonical website record integrated from the verified R1 handoff.