
AI and water: four numbers to check
PROPAGANDA BUSTER · Issue 010 · Editorial review as of 29 September 2026
AI has a water footprint through cooling, electricity generation, and supply chains. Water use varies with the design and location of facilities and with when they operate. These differences matter for local water availability [S02, S03]. GAO identifies gaps in the information needed to isolate generative AI's environmental effects, including water use [A03].
This edition checks four selected numerical claims, including misattribution and an already-corrected unit error. It is not an assessment of all AI impacts. The findings do not establish that a proposed facility is safe for a community's water supply or that AI's overall footprint is small. Reassuring company claims require the same source scrutiny as alarming public claims. None of these checks establishes anyone's motive.
Website record: R7 integrated for September 30, 2026. Research remains reviewed as of September 29. Social posting is a separate action.
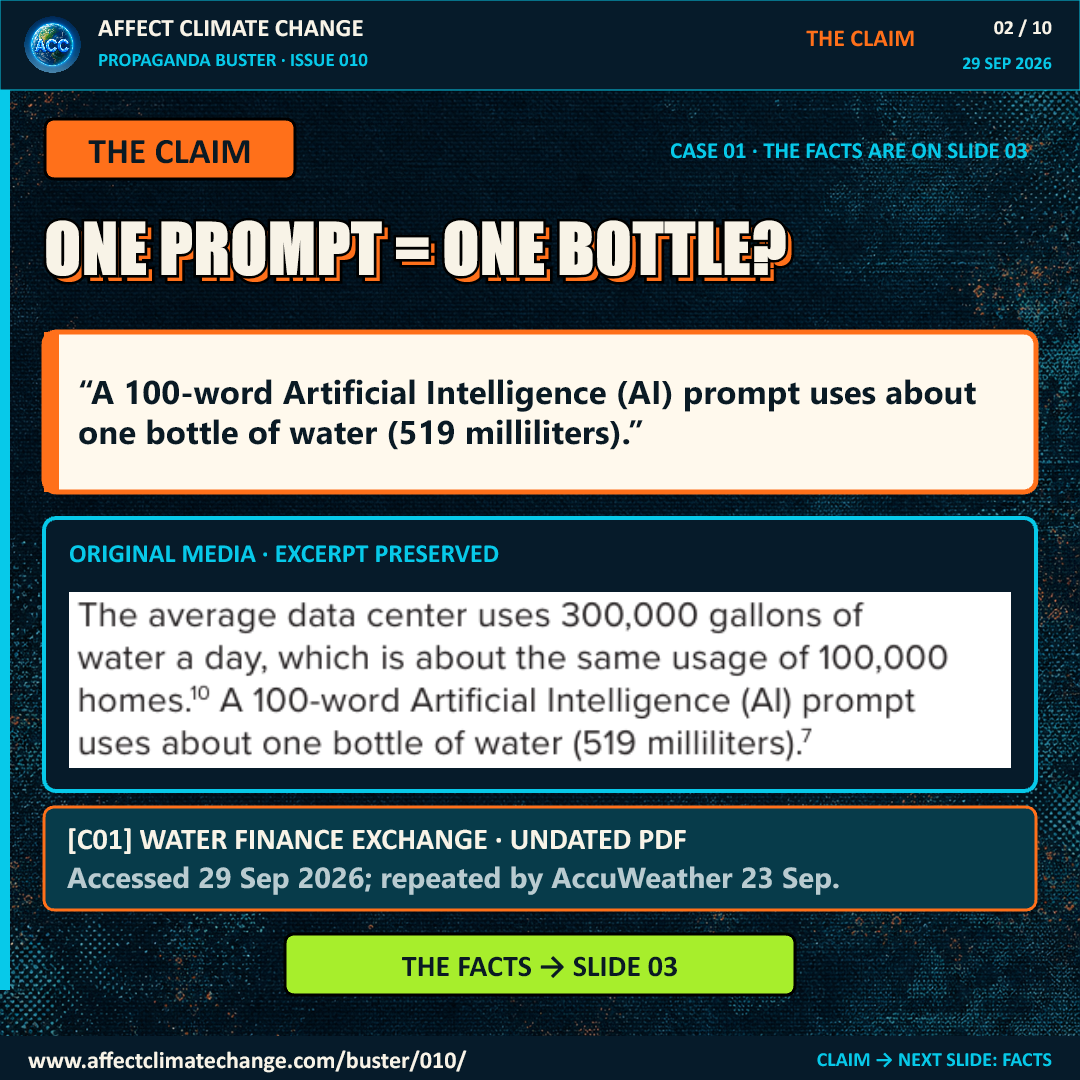
1. Does every 100-word prompt use a bottle of water?
Original claim. Water Finance Exchange (WFX) writes: “A 100-word Artificial Intelligence (AI) prompt uses about one bottle of water (519 milliliters).” [C01] Its four-page Data Centers & Water Systems PDF prints no publication date; file metadata records creation on 13 August 2025, which is not proof of public release that day. AccuWeather recirculated a stronger “Each 100-word AI prompt” wording on 23 September 2026 [A01]. The R5 slide uses WFX's exact “about” wording and identifies WFX as C01.
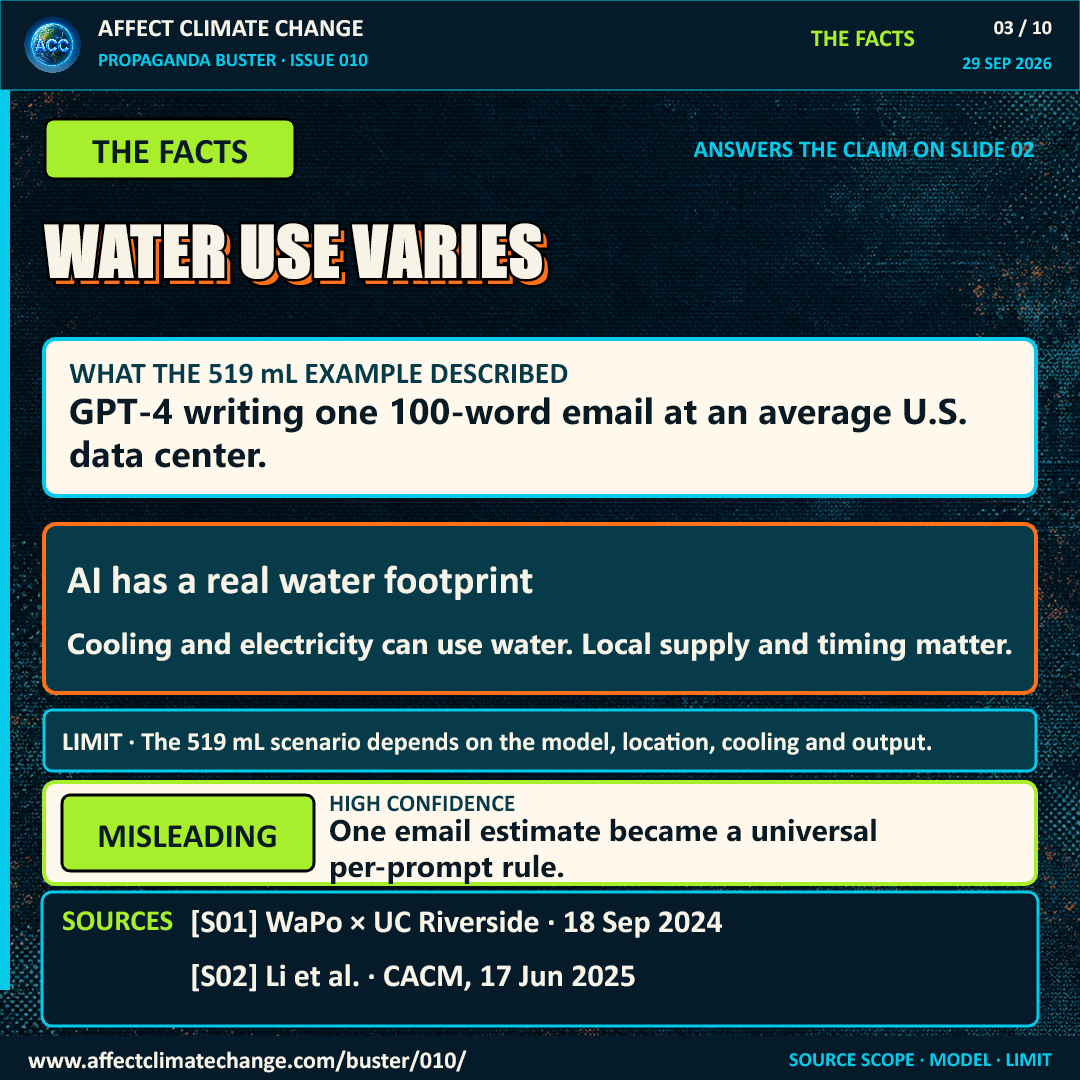
What the estimate covered. The Washington Post and University of California, Riverside researchers modeled the water associated with GPT-4 writing an average 100-word email at an average U.S. data center, published 18 September 2024 [S01]. That is a scenario, not a meter reading or an invariant cost of all prompts. The model, output length, time and place, cooling arrangement, and electricity source can change the result. Li and colleagues separately modeled roughly one 500-millilitre bottle for 10–50 medium-length GPT-3 responses, depending on where and when the model runs [S02]. The GPT-3 and GPT-4 examples should not be combined into a single universal number.
Verdict: MISLEADING · high confidence, bounded to the universal reading. The modeled 519-millilitre example should not become “every prompt uses one bottle.” This does not establish zero water demand per prompt or zero aggregate impact. The Post's full page was restricted in our browser; its indexed methodology and the accessible author manuscript for S02 support this scope distinction, but a final editor should reopen S01 at publication time.
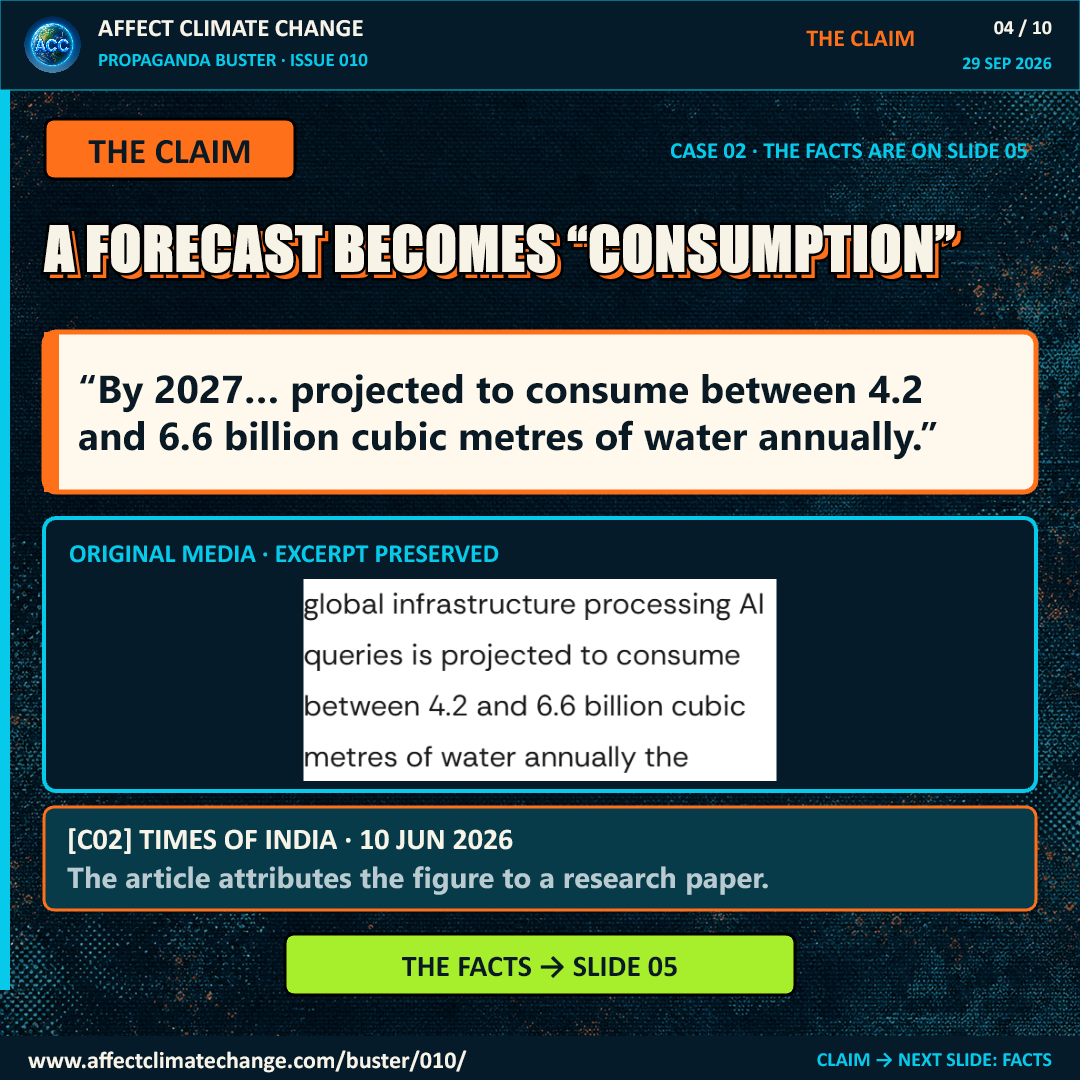
2. Is 4.2–6.6 billion cubic metres a forecast of water consumed?
Original claim. A Times of India article updated 10 June 2026 says global infrastructure processing AI queries is projected to “consume between 4.2 and 6.6 billion cubic metres of water annually” by 2027 [C02]. The article points to research by Pengfei Li and colleagues.
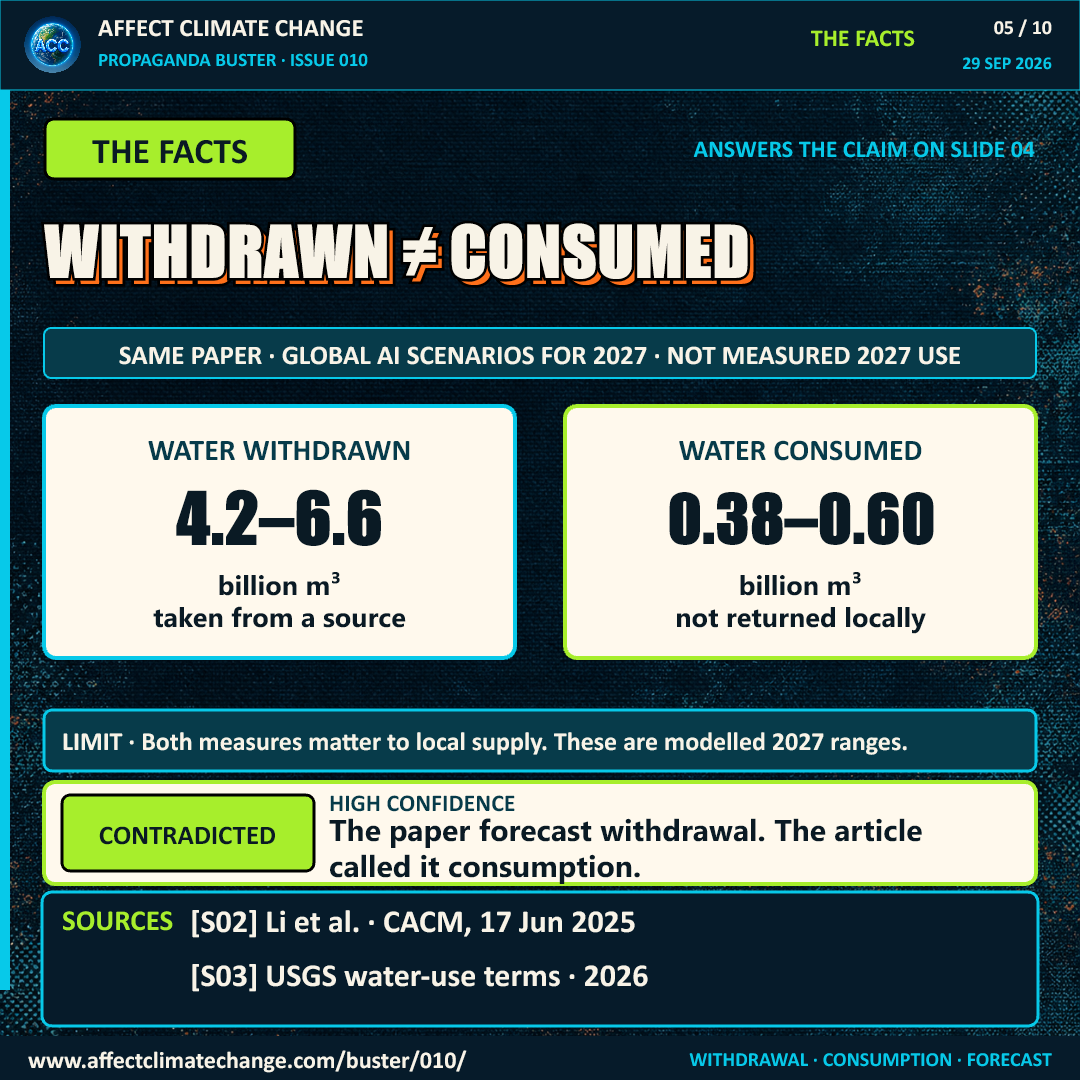
What that research says. Li and colleagues project 4.2–6.6 billion cubic metres of water withdrawal for global AI demand in 2027. In the same paper, 0.38–0.60 billion cubic metres is the modeled consumption range [S02]. Withdrawal means water taken from a source; consumptive use is the portion not returned to the immediate/local water system [S03]. The study includes direct data-center cooling and indirect water associated with electricity generation, and the 2027 numbers are model-derived scenarios rather than measured 2027 totals.
Verdict: CONTRADICTED · high confidence, bounded to the word “consume.” The cited 4.2–6.6 range is for withdrawal, not the paper's consumption estimate. Withdrawal and consumption can both matter for water planning, but they answer different questions.
3. Did AI-only U.S. data centers consume 264 billion gallons in 2025?
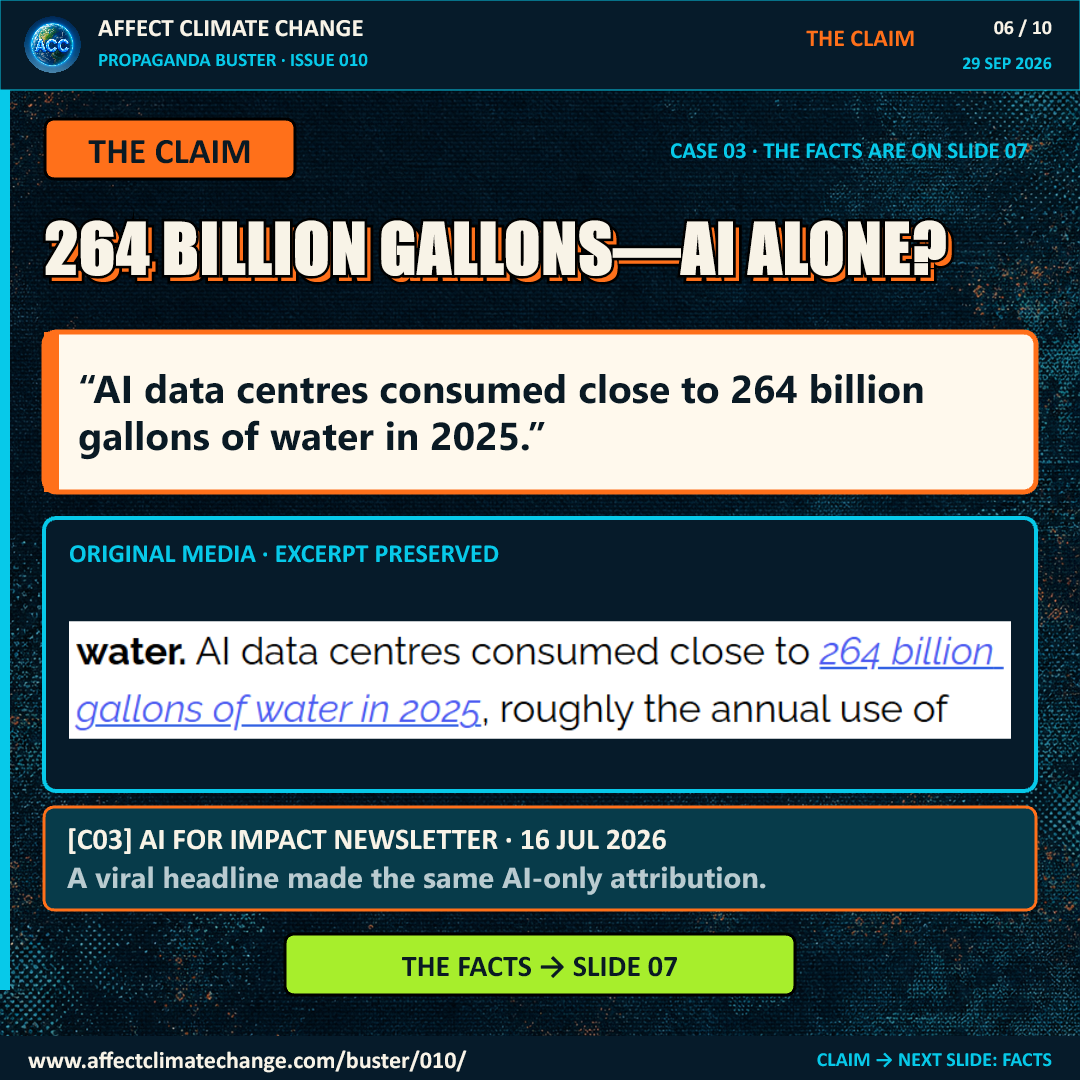
Original claim. AI for Impact's 16 July 2026 newsletter says “AI data centres consumed close to 264 billion gallons of water in 2025” [C03], linking to a June 2026 Barchart headline that also calls the figure AI-specific [A02]. The newsletter additionally gives a rate of about 550 million gallons per day.
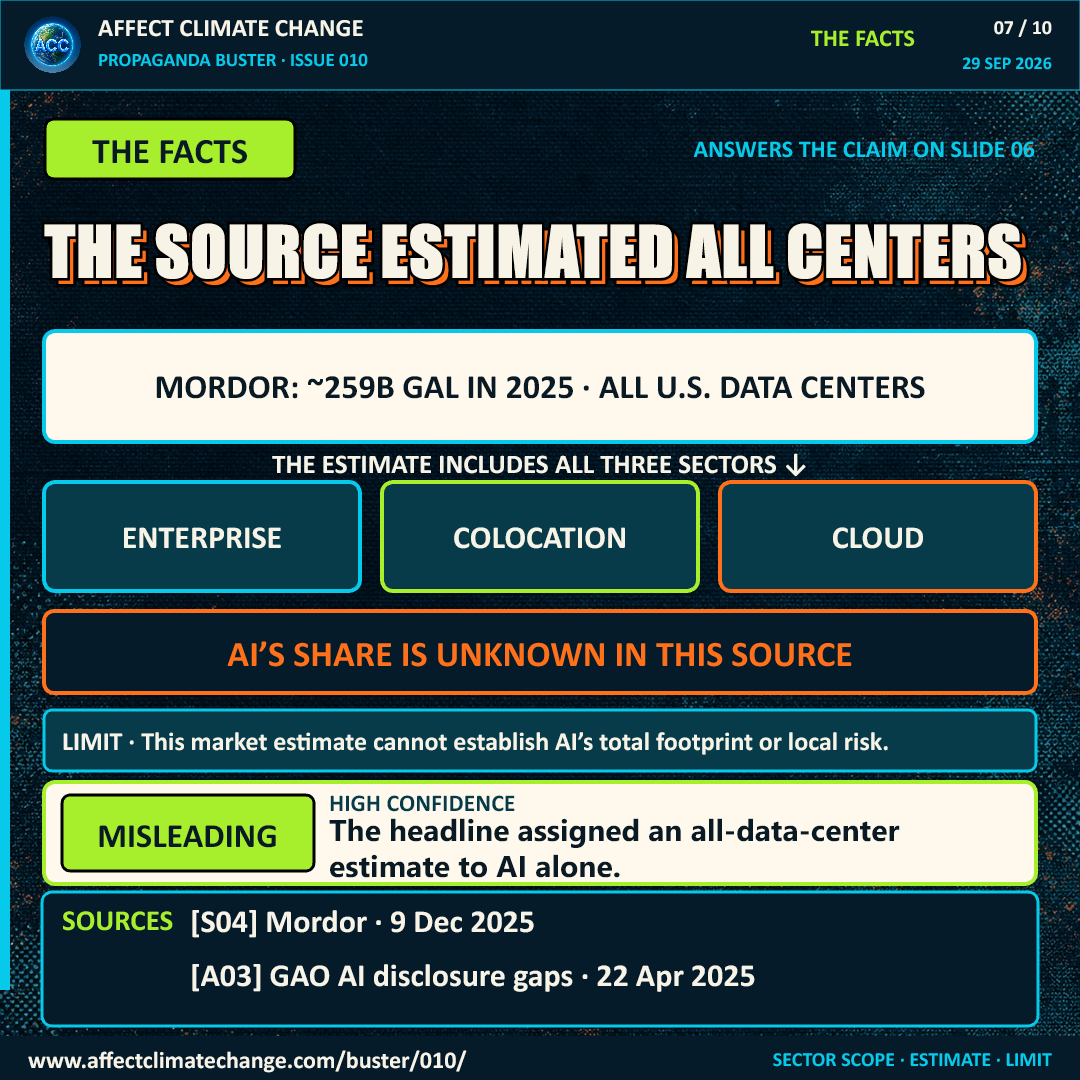
What the cited market estimate covers. Mordor Intelligence reports 0.98 trillion litres for the entire U.S. data-center water-consumption market in 2025; its scope includes enterprise, colocation, and cloud-service-provider data centers and does not publish a separately measured AI-only subtotal [S04]. Converting its stated 0.98 trillion litres gives about 259 billion U.S. gallons, not exactly 264 billion. The 264-billion figure is consistent with first rounding to one trillion litres, but that derivation is an inference, not a disclosed Barchart calculation. Also, 264 billion gallons per year would average about 723 million gallons per day; 550 million per day would annualize to about 201 billion gallons. The two rates cannot describe the same annual total without an unreported change of period or method [A02]. Mordor's underlying model is proprietary; we have not independently validated its national value or the exact meaning of “consumption” across its inputs.
Verdict: MISLEADING · high confidence for the AI-only attribution; low confidence in the precise national magnitude. The cited source describes all U.S. data centers, not AI alone. A separate research paper models a global 2025 AI water footprint of 312.5–764.6 billion litres [A04]. That is not a measured U.S. AI-only subtotal and is not directly comparable with Mordor's U.S. all-center market estimate. It does reinforce that the AI footprint is potentially substantial and poorly disclosed. GAO likewise says developers generally do not report enough detail to isolate generative-AI water use [A03].
4. Did a Microsoft campus face an 8.4-billion-gallon annual municipal projection?
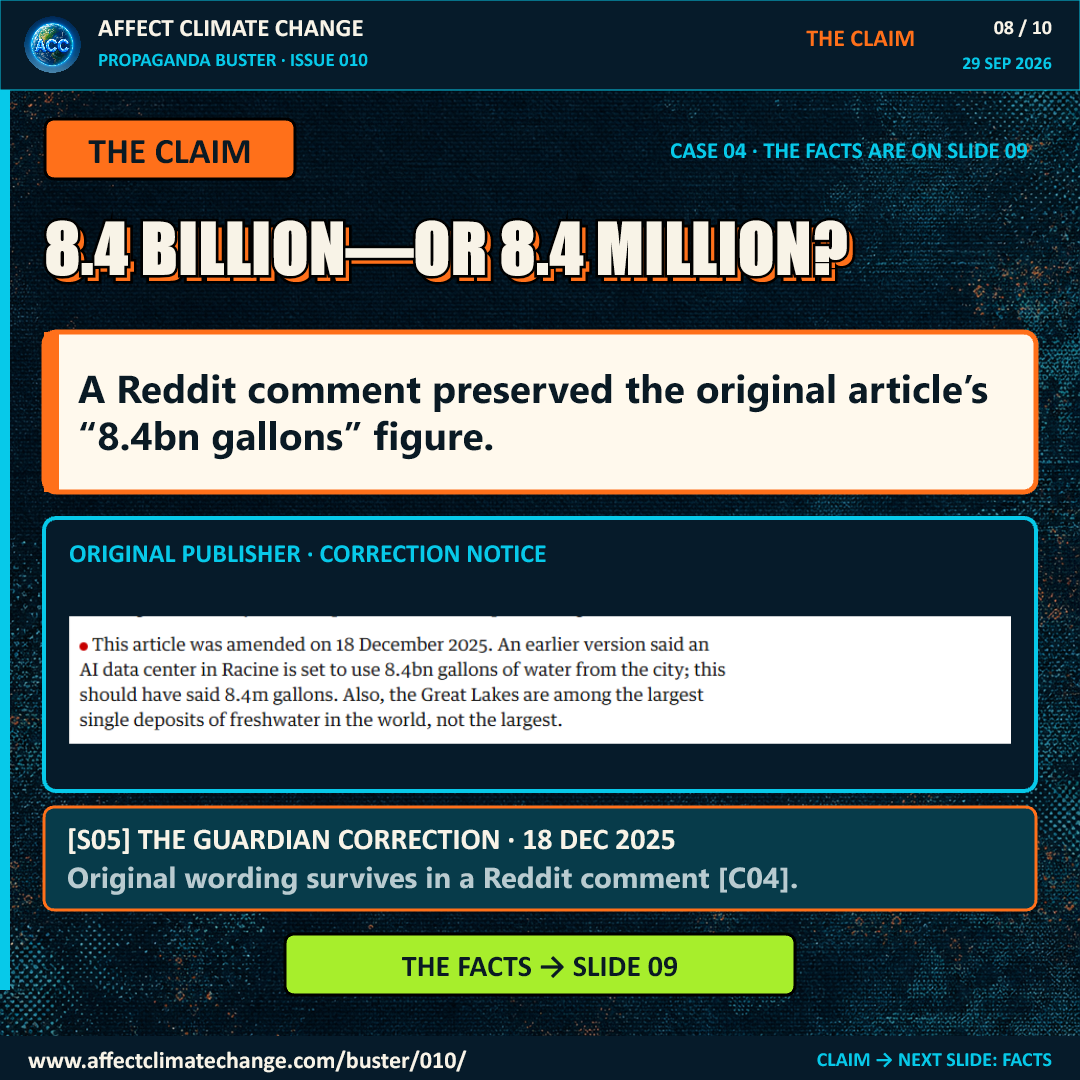
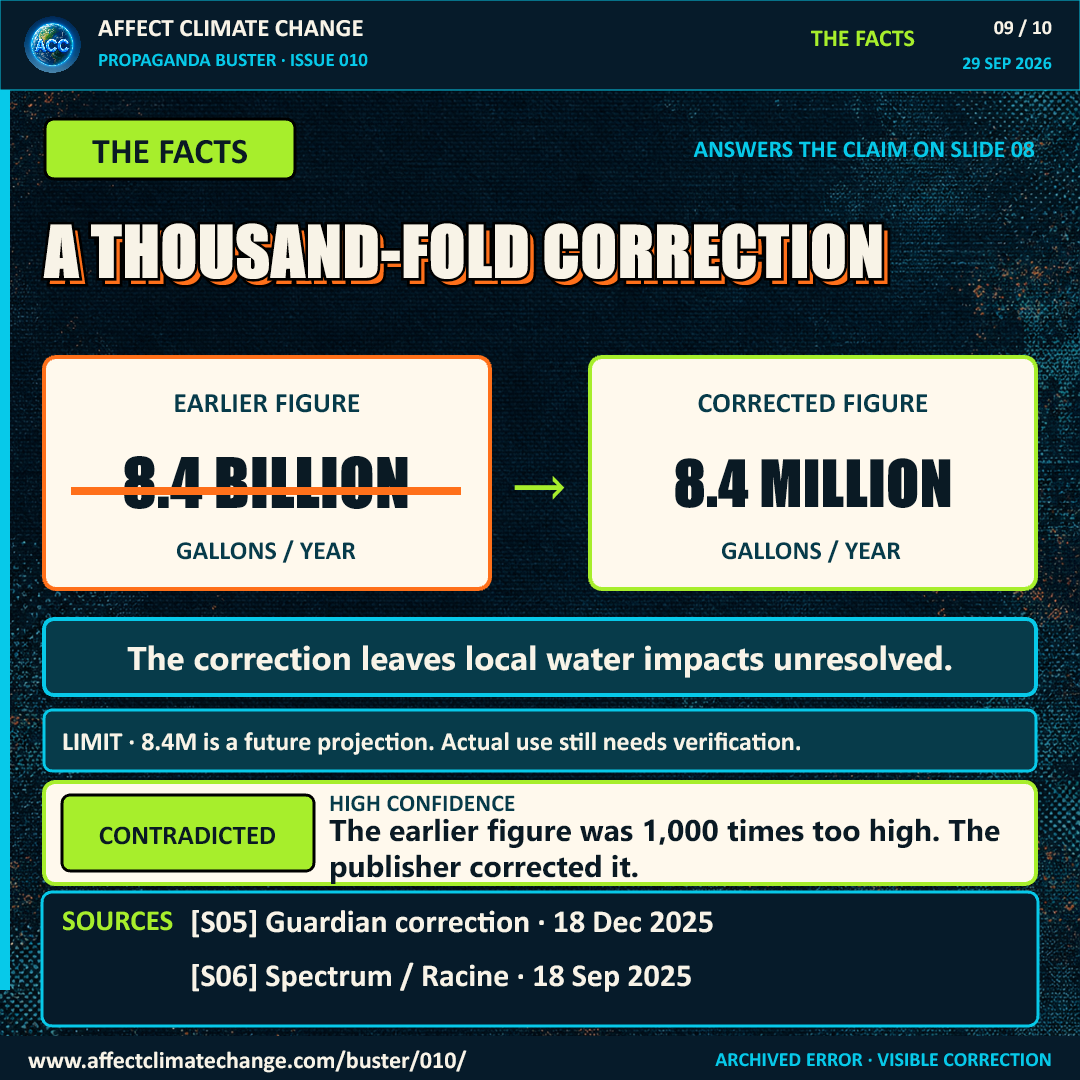
Original claim and correction. A comment in a contemporaneous Reddit thread linking to The Guardian's Great Lakes article preserves an earlier passage saying the planned Mount Pleasant, Wisconsin, Microsoft facility was expected to use up to 8.4bn gallons of municipal water each year [C04]. The top-level post links to the article; the copied passage appears in a comment, not the post body. The Guardian's current article explicitly says its 18 December 2025 amendment changed 8.4bn to 8.4m gallons [S05]. Spectrum News 1 had already corrected a similar billion-versus-million error in its own 18 September 2025 report; it attributes the figures to data obtained from the City of Racine [S06]. Public page text was readable through web research, but the local browser showed a network-security block. The slide therefore visibly labels its image as the original publisher's correction notice, not a Reddit screenshot. C04's immutable visual capture remains incomplete.
What the corrected figure means. Spectrum reports 2.8 million gallons per year projected for 2026 and 8.4 million in the future for Microsoft's Racine County data-center development [S06]. These are municipal-demand projections, not measured current consumption. The corrected 8.4-million figure is one-thousandth of 8.4 billion. The Guardian's correction fixes its old figure; this verdict does not apply to the corrected article.
Verdict: CONTRADICTED · high confidence, bounded to the archived 8.4-billion claim. The publisher's correction and Spectrum's city-sourced report directly reject the old unit scale. Public questions about the campus's future water supply, cooling design, seasonal demand, and actual metered use remain legitimate.
What the corrections do—and do not—tell us
The remaining water questions deserve equal visibility. Some cooling systems consume freshwater, and electricity supply can add an off-site water footprint. Hot conditions can increase evaporative cooling demand when local supplies are already under pressure [S02, §2.2]. Total annual figures can obscure those local and seasonal conditions. The proposed response is facility-level disclosure and assessment against current local water availability, rather than assuming a national average answers a particular community's question. This is an editorial recommendation, not a verified operating standard or a finding that a particular facility has caused harm.
None of these corrections means data-center water demand is trivial. The available figures mix global and U.S. geography, AI workloads and all data centers, direct cooling and electricity-related water, withdrawal and consumptive use, modeled scenarios and reported observations, and present use and future projections. Those categories must stay separate. Water demand is also place-specific: a gallon drawn during a hot or dry period can matter more locally than a national annual total suggests [S02, S03]. The evidence here does not establish that data centers caused a particular change in Great Lakes water level, nor does it quantify an AI-only share of Mordor's U.S. total.
Better questions and practical responses
| Response | Status as of 29 September 2026 | What to verify and what it cannot promise |
|---|---|---|
| Publish facility-level water withdrawals, consumptive use, cooling method, seasonal peaks, and electricity-related water; identify AI versus non-AI workloads when defensible. | PROPOSED / EMERGING as a disclosure approach [A03, A04]. | GAO and the independent study identify substantial reporting gaps. No nationwide operating mandate or complete AI-specific dataset was established for this issue. Reporting improves accountability; it does not itself reduce water demand. |
| Test a proposed facility against local supply, drought season, competing uses, utility capacity, and the difference between projected demand and metered operation. | PROPOSED / EMERGING as a project-review practice [C01, S03]. | WFX frames this as community water-supply planning. A site-specific assessment needs current utility and permit records. No universal safe threshold follows from a national average. |
| Use recycled or non-potable water, closed-loop cooling, and site-specific cooling design where appropriate. | COMMITTED / PLANNED for the cited Mount Pleasant design: Microsoft said in 2025 that more than 90% of the facility would use a closed-loop system [S06]. WFX also discusses reuse as a design option [C01]. | The Microsoft statement is a company plan, not independently measured post-opening performance. Closed-loop or dry cooling can lower on-site freshwater demand but may change electricity use and off-site water impacts [S02]. Reuse depends on water quality, infrastructure, cost, and local permits. |
| Shift flexible computing to times or places with lower total water intensity where feasible. | PROPOSED / EMERGING research direction [S02]. | Li and colleagues document spatial and temporal variation. Feasibility depends on workload, grid, cooling, latency, and local water stress; no issue-wide savings percentage is claimed. |
Source and method record
We inspected each original claim before assigning a verdict, preserving native visual captures where access allowed. C04 has an explicit visual-capture gap; the original publisher's correction is displayed and labeled instead. The compact markers below resolve to the machine-readable source ledger, which records source relationships, dates, locators, evidence state, confidence, raw-capture gaps, and corrections. Access checks were performed on 29 September 2026; source publication, last-modified, and studied periods remain distinct. We use MISLEADING for a real estimate whose presentation changes its meaning and CONTRADICTED only for a metric or unit directly rejected by the cited source. The series name does not imply intent to deceive. Incidental statements visible around a source excerpt are not independently endorsed by ACC.
- [C01] Water Finance Exchange, Data Centers & Water Systems, undated on page; PDF metadata creation 13 August 2025. Original PDF, p. 1. Original source retained for editorial verification.
- [C02] TOI Science Desk, AI's secret water crisis, updated 10 June 2026, opening paragraphs. Direct browser capture succeeded with HTTP 200 on 29 September. The unaltered native-text excerpt and full-page context are retained.
- [C03] AI for Impact, AI Can See the Forest Burning. It Is Also Draining the River, 16 July 2026, “Now the part...” paragraph. Local claim crop retained.
- [C04] r/technology, thread linking to The Guardian article, contemporaneous with the December 2025 article; exact comment timestamp not independently confirmed. A comment by Wagamaga preserves the earlier article text; public page text was inspectable through web research, but local visual capture was blocked.
- [S01] Pranshu Verma and Shelly Tan, The Washington Post/UCR GPT-4 email estimate, 18 September 2024, introduction and methodology. Direct full-page access restricted; indexed article text describes the model.
- [S02] Pengfei Li, Jianyi Yang, Mohammad A. Islam, and Shaolei Ren, Making AI Less “Thirsty”, author manuscript v5, 26 March 2025, abstract and §§1–2; Communications of the ACM version, 17 June 2025, 68(7):54–61. The accessible manuscript directly supports the ranges and definitions; the publisher full page was restricted.
- [S03] U.S. Geological Survey, Water Use in the United States, updated 9 September 2026, “Withdrawals and Consumptive Use.”
- [S04] Mordor Intelligence, United States Data Center Water Consumption Market, page last updated 9 December 2025, market overview and report scope.
- [S05] Stephen Starr, The Guardian Great Lakes/data-centers report, published 16 December 2025, correction note dated 18 December 2025; page last modified 10 June 2026.
- [S06] Rachel Ryan, Haley Kosik, and Spectrum News staff, Spectrum News 1 Racine/Microsoft report, 18 September 2025, City of Racine figures and editor's correction.
- [A01] Riley Meade, AccuWeather recirculation of the per-prompt claim, 23 September 2026. Secondary repetition, not the WFX wording.
- [A02] Caleb Naysmith, Barchart 264-billion-gallon headline, 6 June 2026. Used to trace the newsletter's attribution and unexplained daily rate, not as a measurement.
- [A03] U.S. Government Accountability Office, Generative AI's Environmental and Human Effects, GAO-25-107172, 22 April 2025, environmental effects and policy options.
- [A04] Alex de Vries-Gao, The carbon and water footprints of data centers and what this could mean for artificial intelligence, Patterns, published 17 December 2025, 7(1):101430, summary and discussion. Modeled global AI estimate with major disclosure uncertainty; not a substitute for an observed U.S. total.
Publication-time source check
The core PDF, withdrawal/consumption manuscript, USGS, Mordor, GAO and both publisher-correction records were reopened on September 30. The Washington Post article text was also readable through the research tool; the earlier local browser restriction remains part of the review history. The independent Patterns study encountered an access challenge in this refresh, so its previously reviewed estimate is not newly claimed as an independent measurement. No access restriction is treated as evidence against a claim.