
Atmospheric carbon dioxide, about 52% above the preindustrial reference level.
ACC Education Center • Climate foundations
The greenhouse effect makes Earth livable. Human activity is turning it up.
Sunlight warms the planet. Earth sends energy back toward space as infrared heat. Greenhouse gases slow part of that outward flow. The natural process supports life; adding long-lived gases strengthens it and shifts the climate system out of balance.
Evidence-led guide using IPCC, WMO, NOAA, and supporting research sourcesThe idea in one minute
Climate starts with an energy budget.
Earth's temperature is shaped by the balance between energy arriving from the Sun and energy leaving for space. Greenhouse gases interact mainly with the infrared energy Earth emits—not with most incoming visible sunlight. Raise the concentration of those gases, and the planet initially loses less energy than it receives. Warming continues until outgoing energy catches up at a higher temperature.
Energy arrives
Sunlight reaches Earth. Some is reflected; the rest is absorbed by the atmosphere and surface.
Earth emits heat
The warmed surface and atmosphere emit longer-wave infrared energy toward the atmosphere and space.
Gases change the exit
Greenhouse gases absorb selected wavelengths and emit energy in every direction, slowing heat loss to space.
Follow the energy
The greenhouse effect changes how Earth cools.
The clearest way to understand the greenhouse effect is to trace energy. Sunlight arrives mostly at shorter wavelengths. A warmer Earth emits energy at longer infrared wavelengths. Greenhouse gases are largely transparent to incoming visible light but absorb particular bands of outgoing infrared radiation.
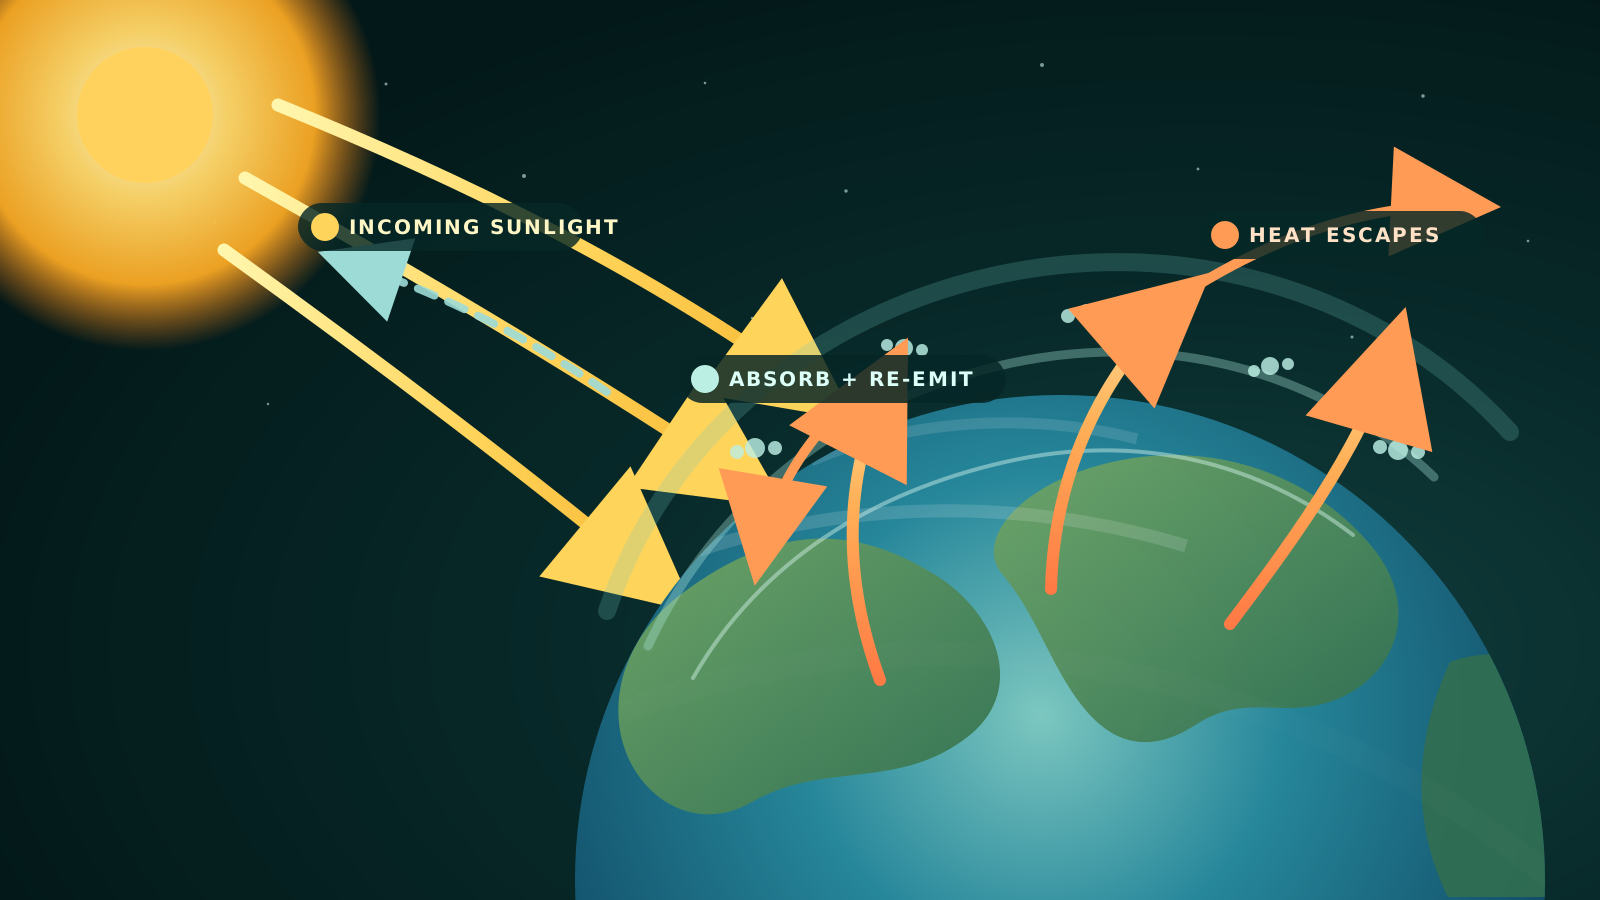
Most incoming solar energy is shortwave radiation, including visible light.
Clouds, aerosols, ice, and bright surfaces send part of that energy back to space.
Land, oceans, and the atmosphere absorb the rest and transfer energy through radiation, evaporation, and convection.
Every warm surface emits energy. For Earth's temperatures, much of it is longwave infrared radiation.
Greenhouse gases absorb selected wavelengths and emit them in all directions. Some energy returns downward; some continues upward.
The atmosphere does not act like a lid that permanently locks heat inside. Energy continues to leave. The important change is where and how efficiently it leaves. As greenhouse-gas concentrations rise, the average level from which infrared energy escapes to space shifts higher in the atmosphere. Because the troposphere generally gets colder with altitude, that higher layer initially radiates less energy to space. The surface and lower atmosphere then warm until the planet again sends out as much energy as it absorbs.
This is why scientists describe greenhouse gases as a radiative forcing: they disturb the balance at the top of the atmosphere. NOAA's observation-based Annual Greenhouse Gas Index estimates that in 2024, the increase in 22 long-lived greenhouse gases retained an additional 3.54 watts per square meter relative to preindustrial conditions. That sounds small only until it is applied continuously across Earth's entire surface. Review the NOAA calculation and its limits.
Greenhouse gases do not absorb every wavelength equally. Each molecule has an absorption pattern, like a spectral fingerprint. Carbon dioxide absorbs strongly in bands that matter for Earth's outgoing energy, including regions where water vapor does not fully block the path to space. Adding CO2 therefore continues to influence the energy budget even when parts of an absorption band are already strong near the surface. See the IPCC assessment of Earth's energy budget and radiative forcing.
Natural and enhanced effects
The problem is not that greenhouse gases exist. It is that their concentrations changed rapidly.
Water vapor, carbon dioxide, methane, nitrous oxide, ozone, clouds, and other infrared absorbers give Earth a naturally warmer surface than it would have with no greenhouse effect. Human activity has added long-lived gases faster than natural systems remove them, strengthening that effect.
Life-supporting warmth
The atmosphere absorbs and re-emits infrared energy, keeping the surface roughly 33°C (59°F) warmer on average than a simple airless-Earth calculation. Water vapor and clouds are major parts of this natural effect, supported by non-condensing gases such as CO2.
Key idea: natural does not mean fixed.An added energy imbalance
Burning coal, oil, and gas; producing cement; changing land cover; agriculture; waste; and industrial chemicals raise CO2, methane, nitrous oxide, and fluorinated-gas concentrations. The added gases reduce infrared loss until warming restores balance.
Key idea: extra concentration produces extra forcing.Before industrialization, carbon moved among the atmosphere, oceans, land, and living systems through natural cycles. Those flows were not motionless, but they were close enough to long-term balance that atmospheric CO2 stayed within a relatively narrow range for thousands of years. Fossil-fuel combustion transfers carbon from geologic storage into the active atmosphere-ocean-land system. Land and ocean sinks absorb a large share, but not all. The remainder accumulates in the atmosphere.
The distinction between emissions and concentration matters. Cutting annual CO2 emissions slows the rate of accumulation. Atmospheric CO2 begins a sustained decline only when removals exceed remaining additions. This is also why cumulative CO2 emissions are closely related to total warming. Explore the IPCC carbon-cycle assessment.
What the atmosphere shows
Three major long-lived gases reached record global averages in 2024.
The WMO Global Atmosphere Watch network combines measurements from observing stations around the world. These are globally averaged surface concentrations, not readings from one mountain or one month.
Carbon dioxide423.9 ppm
2024 global average, compared with a preindustrial reference near 278 ppm.
Methane1,942 ppb2024 global average. Parts per billion are not directly comparable with CO2 potency.
Nitrous oxide338.0 ppb2024 global average. A long-lived gas strongly linked to agriculture and industry.
Meet the gases
Different gases play different roles on different timescales.
There is no single honest ranking without a question attached. A gas can be abundant or scarce, strong or weak per molecule, short-lived or persistent, naturally produced or human-made. Climate impact depends on all of those properties plus the amount emitted and the timeframe being considered.
| Gas | Climate role | Important sources | How to describe it carefully |
|---|---|---|---|
| Carbon dioxideCO2Long-lived forcing | The largest contributor to the rise in forcing from NOAA's tracked long-lived gases. Its warming influence is closely tied to cumulative emissions. | Fossil-fuel combustion, cement production, deforestation and other land-use change; also natural respiration, ocean exchange, fire, and volcanoes. | A pulse does not have one simple lifetime. Some is absorbed quickly, while a meaningful fraction affects climate for centuries to millennia. |
| MethaneCH4Powerful, shorter-lived | A strong warming agent over decades. It also influences ozone and stratospheric water vapor before oxidizing mainly to CO2 and water. | Wetlands; fossil-fuel production and transport; livestock; rice; landfills; manure; and biomass burning. | Comparisons with CO2 must state a time horizon. “About 80 times” refers to a 20-year mass-based metric, not a permanent universal ratio. |
| Nitrous oxideN2OLong-lived forcing | A potent, long-lived greenhouse gas that also contributes to stratospheric ozone depletion. | Agricultural soils and fertilizer, manure, industry, combustion, and natural soil and ocean processes. | Its concentration is much lower than CO2, but molecules absorb infrared efficiently and remain in the atmosphere for about a century on average. |
| Water vaporH2OFast feedback | The most abundant greenhouse gas and a major part of the natural effect. In present climate change it acts mainly as an amplifying feedback. | Evaporation and condensation within the water cycle; human water emissions are generally small compared with natural flows. | Warm air can hold more moisture. Because water condenses and rains out quickly, temperature controls its global abundance more than direct emissions do. |
| OzoneO3Location matters | Ozone absorbs radiation and affects climate. Its role differs between the lower atmosphere and the protective stratospheric ozone layer. | Formed through atmospheric chemistry. Ground-level ozone comes from reactions involving nitrogen oxides, carbon monoxide, methane, and volatile organic compounds. | Global warming and the ozone hole are distinct problems. Some chemicals connect them, but ozone depletion does not explain modern surface warming. |
| Fluorinated gasesF-gasesIndustrial gases | Many are extremely efficient infrared absorbers. Some remain for centuries or longer even at very low concentrations. | Refrigeration, air conditioning, electrical equipment, semiconductor production, foams, fire suppression, and other industrial uses. | Individual gases differ enormously. Regulations on ozone-depleting substances and HFCs have climate benefits, but substitutes must also be evaluated. |
Water vapor often causes confusion. It contributes more to the natural greenhouse effect than CO2, but it does not make added CO2 irrelevant. Water vapor condenses and rains out; its average concentration responds quickly to temperature. Long-lived non-condensing gases can hold the initial warming in place, allowing the atmosphere to contain more moisture. That extra water vapor then amplifies the original change. In climate language, CO2 is a forcing and water vapor is primarily a feedback. Review the IPCC feedback framework.
How we know
The conclusion does not rest on one thermometer, one model, or one institution.
The greenhouse mechanism was studied in laboratories long before modern global warming became obvious. Today it is tested through atmospheric chemistry, ice cores, surface instruments, satellites, ocean measurements, vertical temperature patterns, and model experiments. Independent evidence points to the same cause.
Molecules have measurable spectra.
Laboratory spectroscopy shows exactly which infrared wavelengths CO2, methane, water vapor, and other gases absorb and emit. Radiative-transfer calculations use those measured properties and can be checked against atmospheric observations.
Ancient air and modern stations connect.
Air trapped in ice records past greenhouse-gas concentrations. Direct atmospheric monitoring then extends the record through the modern period. The abrupt industrial-era rise is visible across independent datasets.
The added carbon carries a fingerprint.
Fossil carbon changes the ratio of carbon isotopes in the atmosphere. Atmospheric oxygen also declines as carbon burns. Together with fuel-use records, these observations identify combustion rather than volcanoes as the dominant source of the increase.
The warming pattern matches greenhouse forcing.
The lower atmosphere and oceans warm while the stratosphere cools, nights often warm faster than days, ice loses mass, and ocean heat rises. Increased solar output alone would not produce this complete pattern.
Energy changes can be observed directly.
Satellites and surface instruments measure incoming solar energy, outgoing infrared radiation, and downward longwave radiation. Changes occur in the spectral bands expected from rising greenhouse gases.
Models test competing explanations.
Simulations driven only by natural factors do not reproduce the observed long-term warming. When human greenhouse gases, aerosols, land changes, and natural factors are included, the observed pattern emerges much more closely.
Models are important, but the case would not disappear without them. We directly measure the gas increase, know the gases' infrared properties, observe the fossil-carbon signature, see an energy imbalance, and record heat accumulating across the climate system. Models connect those pieces, test counterfactuals, and estimate ranges; they are one line of evidence within a much larger body.
Forcings and feedbacks
Greenhouse gases start a change. The climate system responds.
A forcing pushes Earth's energy budget. A feedback is a process triggered by the resulting temperature change that either amplifies or reduces it. “Positive” means amplifying and “negative” means damping—not good and bad.
Long-lived gases rise
Added CO2, methane, and other gases reduce outgoing infrared energy.
Air and oceans warm
More energy accumulates while the climate system moves toward a new balance.
Evaporation increases
A warmer atmosphere can contain more water vapor on average.
More infrared is absorbed
Water vapor adds greenhouse warming, amplifying the initial forcing.
Water vapor + lapse rate
More moisture strengthens greenhouse absorption, while changes in how temperature varies with altitude partly offset that amplification. IPCC assesses the combined feedback as positive.
Snow and ice reflectivity
Bright snow and ice reflect sunlight. As they shrink, darker land and ocean absorb more energy, producing an amplifying surface-albedo feedback.
Clouds do more than one thing
Clouds reflect incoming sunlight and reduce outgoing infrared loss. Individual clouds can cool or warm; the overall cloud feedback to continued warming is assessed as positive, with uncertainty.
Feedbacks do not mean the climate will necessarily run away without limit. A warmer planet emits more infrared energy, a powerful stabilizing response called the Planck feedback. Warming approaches a new balance when the added outgoing radiation offsets the forcing and the combined feedbacks. The scientific question is how much warming is required to reach that balance and how quickly the ocean, ice, ecosystems, and atmosphere respond.
IPCC's best estimate for long-term warming after atmospheric CO2 doubles, including fast climate feedbacks, is about 3°C, with a likely range of 2.5°C to 4°C. This equilibrium climate sensitivity is not a prediction for a date; it is a response measure for a specified concentration change after the system moves toward equilibrium. See the IPCC assessment and uncertainty ranges.
Questions and claim checks
Good skepticism follows the whole chain of evidence.
Climate claims can sound persuasive when they isolate one true fact and leave out the mechanism, scale, or comparison that gives it meaning. Open each question below to see what completes the picture.
“Is the greenhouse effect itself bad?”
No. The natural greenhouse effect makes Earth habitable. The concern is the rapid human-driven increase in long-lived greenhouse-gas concentrations, which strengthens the effect and shifts the climate's energy balance. “Natural” and “human-enhanced” are different parts of the same physical process.
“CO2 is only about 0.04% of the atmosphere. Can a trace gas matter?”
Abundance alone does not determine influence. Molecules interact with specific wavelengths. Ozone protects life at concentrations measured in parts per million or billion; similarly, CO2 absorbs infrared energy in climatically important bands. Its concentration, spectral properties, persistence, and global distribution make a measurable difference to Earth's energy budget. NOAA quantifies that difference from observations.
“If water vapor is the biggest greenhouse gas, why focus on CO2?”
Water vapor is central to the natural greenhouse effect, but it condenses and rains out on short timescales. Its global abundance largely follows temperature. Added CO2 persists, supplies an initial forcing, and raises temperature; additional water vapor then amplifies that warming. Removing the forcing would allow the water response to adjust, while continuously adding CO2 keeps pushing the system.
“Hasn't CO2 already absorbed all the infrared energy it can?”
No. The centers of some absorption bands are strong near the surface, but the band edges, pressure-broadened wings, and higher, thinner atmospheric layers remain responsive to added CO2. Increasing concentration raises the effective altitude from which energy escapes. Satellite and surface spectra show the expected changes as concentrations rise.
“Do volcanoes emit more CO2 than people?”
No. Human CO2 emissions exceed volcanic emissions by well over two orders of magnitude in a typical year. The atmospheric increase also carries the carbon-isotope and oxygen fingerprints of fossil-fuel combustion. Major eruptions can temporarily cool the surface because sulfur particles reflect sunlight, even while releasing some CO2. See the IPCC carbon-cycle evidence.
“Could the Sun be causing the current warming?”
Solar changes affect climate, but measured solar output has not risen enough to explain recent warming. The vertical pattern also matters: stronger sunlight would tend to warm more of the atmosphere, while increased greenhouse gases warm the lower atmosphere and cool the stratosphere. Observations match the greenhouse pattern far better.
“If plants and oceans absorb CO2, why does it accumulate?”
Land and ocean sinks absorb a large fraction of human emissions, which slows the atmospheric rise. They do not absorb all of it. The remainder accumulates year after year. Ocean uptake also changes seawater chemistry, while land uptake varies with drought, fire, ecosystems, and land use. A sink can help without canceling the source.
“Does one cold day or one quiet hurricane season disprove warming?”
No. Weather varies across days, places, and years; climate describes long-term patterns and probability distributions. The greenhouse effect does not prescribe every local event. Researchers examine decades of global and regional records, ocean heat, ice, sea level, atmospheric composition, and event-attribution evidence rather than using one episode as the entire test.
“Is the ozone hole the cause of global warming?”
No. Ozone depletion and greenhouse warming are related atmospheric problems but not the same mechanism. The ozone layer regulates ultraviolet radiation; rising long-lived greenhouse gases alter infrared energy flow. Some industrial chemicals affect both ozone and climate, which is why policy can produce benefits for both.
A three-question test for any greenhouse-effect claim
- What quantity is being discussed?
Emissions, atmospheric concentration, radiative forcing, temperature, or a feedback are not interchangeable. - What comparison and timeframe are used?
A global annual average is not a local monthly peak; a 20-year gas metric is not a permanent ratio. - Does the explanation fit all evidence?
A serious alternative must explain the gas increase, isotope signature, energy spectrum, ocean heat, and vertical warming pattern together.
How the added effect is slowed
Stop strengthening the forcing, and warming can stabilize.
Every additional net tonne of CO2 adds to cumulative emissions. Reaching and sustaining global net-zero CO2 is required to stabilize CO2-driven warming. Deep reductions in methane, nitrous oxide, and fluorinated gases can lower the peak and improve the path there.
Replace combustion and use energy efficiently.
Clean electricity, efficient buildings and equipment, electrified transport and heat, lower-carbon industry, and reduced fossil-fuel dependence address the largest long-term forcing.
Cut methane at the source.
Detect fossil-fuel leaks, end routine venting and flaring, improve waste and manure systems, and change practices where agriculture emissions can be reduced responsibly.
Use nitrogen more precisely.
Better fertilizer timing, placement, rates, soil practices, and industrial controls can reduce nitrous oxide while supporting food production and water quality.
Manage refrigerants and industrial gases.
Prevent leaks, recover gases at end of life, use lower-impact substitutes, and improve cooling efficiency without trading climate progress for unsafe systems.
Protect natural carbon stores.
Reduce deforestation, protect mature ecosystems, restore damaged land, and improve soil stewardship. These steps complement fossil-emissions cuts; they do not replace them.
Use removals for a defined job.
Carbon dioxide removal can counterbalance hard-to-eliminate residual emissions, but durability, scale, energy, land, cost, and verification determine whether a method helps.
Climate response is not instantaneous. IPCC scenarios indicate that atmospheric CO2 trends respond before global temperature trends become clearly distinguishable from natural variability. That delay is not evidence that reductions fail; it reflects the size and inertia of the climate system. Avoided emissions still prevent additional accumulation, and every avoided increment of warming reduces risk. Read IPCC FAQ 4.2 on the timing of emissions reductions and climate response.
Sources and review notes
Read the evidence behind the guide.
ACC uses international assessments and observation networks for the scientific spine, then adds established technical and educational sources where they clarify a mechanism or measurement. Exact annual figures are visibly dated so they can be refreshed without rewriting the durable explanation.
Core assessment and definitions
- IPCC AR6 Working Group I, Chapter 7: Earth's Energy Budget, Climate Feedbacks, and Climate SensitivityRadiative forcing, feedbacks, energy balance, greenhouse-gas contributions, and climate sensitivity.
- IPCC AR6 Working Group I: Summary for PolicymakersObserved warming, human influence, cumulative emissions, future response, and assessed confidence.
- IPCC AR6 Working Group I: Frequently Asked QuestionsPlain-language explanations of attribution, energy balance, emissions reductions, clouds, carbon budgets, and climate evidence.
- IPCC AR6 Synthesis ReportIntegrated conclusions on causes, risks, mitigation, adaptation, and the relationship between net-zero emissions and warming.
Atmospheric measurements and radiative forcing
- WMO Greenhouse Gas Bulletin No. 21Globally averaged 2024 concentrations of carbon dioxide, methane, and nitrous oxide from the Global Atmosphere Watch network.
- NOAA Global Monitoring Laboratory: Annual Greenhouse Gas IndexObservation-based changes through 2024 in effective radiative forcing from 22 long-lived greenhouse gases.
- NOAA Global Monitoring Laboratory: Carbon Cycle Greenhouse Effect BasicsSupplemental explanation of energy flow, the natural effect, atmospheric absorption, and the difference from a glass greenhouse.
Supporting mechanism and evidence context
- The Royal Society and U.S. National Academy of Sciences: Climate Change Evidence and CausesIndependent synthesis of greenhouse physics, attribution evidence, and common scientific questions.
- U.S. EPA: Overview of Greenhouse GasesSupplemental sector and source context for carbon dioxide, methane, nitrous oxide, and fluorinated gases.
REV
Review and update plan
Science and copy reviewed July 28, 2026. Refresh WMO annual concentrations and NOAA AGGI after their next official releases. Keep global annual averages separate from Mauna Loa or preliminary monthly values. Recheck external links, IPCC assessment language, and any gas-comparison metric during each substantive review.