Precise proposition checked
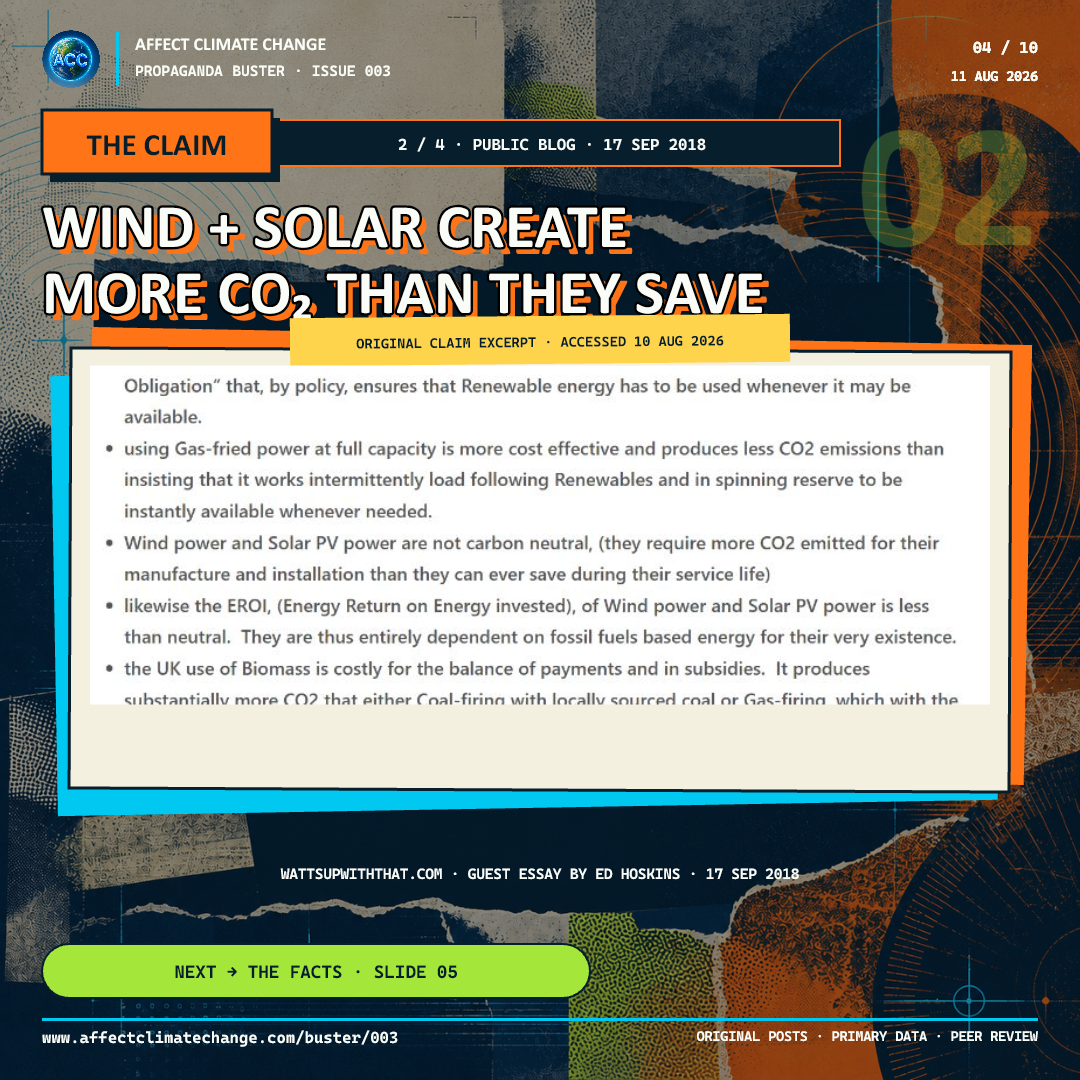
Manufacturing and installing wind and solar produces more CO2 than the technologies save during their service lives.
Full post context: A September 17, 2018 public blog essay lists this as a conclusion about wind and solar photovoltaic systems. ACC evaluates that absolute lifecycle-emissions statement, not every cost, reliability, siting, or materials claim made on the page.
Scope of this check: The verdict addresses the absolute lifecycle greenhouse-gas claim. It does not imply that wind and solar have no construction emissions or no material, siting, grid-integration, or end-of-life impacts.
What the evidence shows
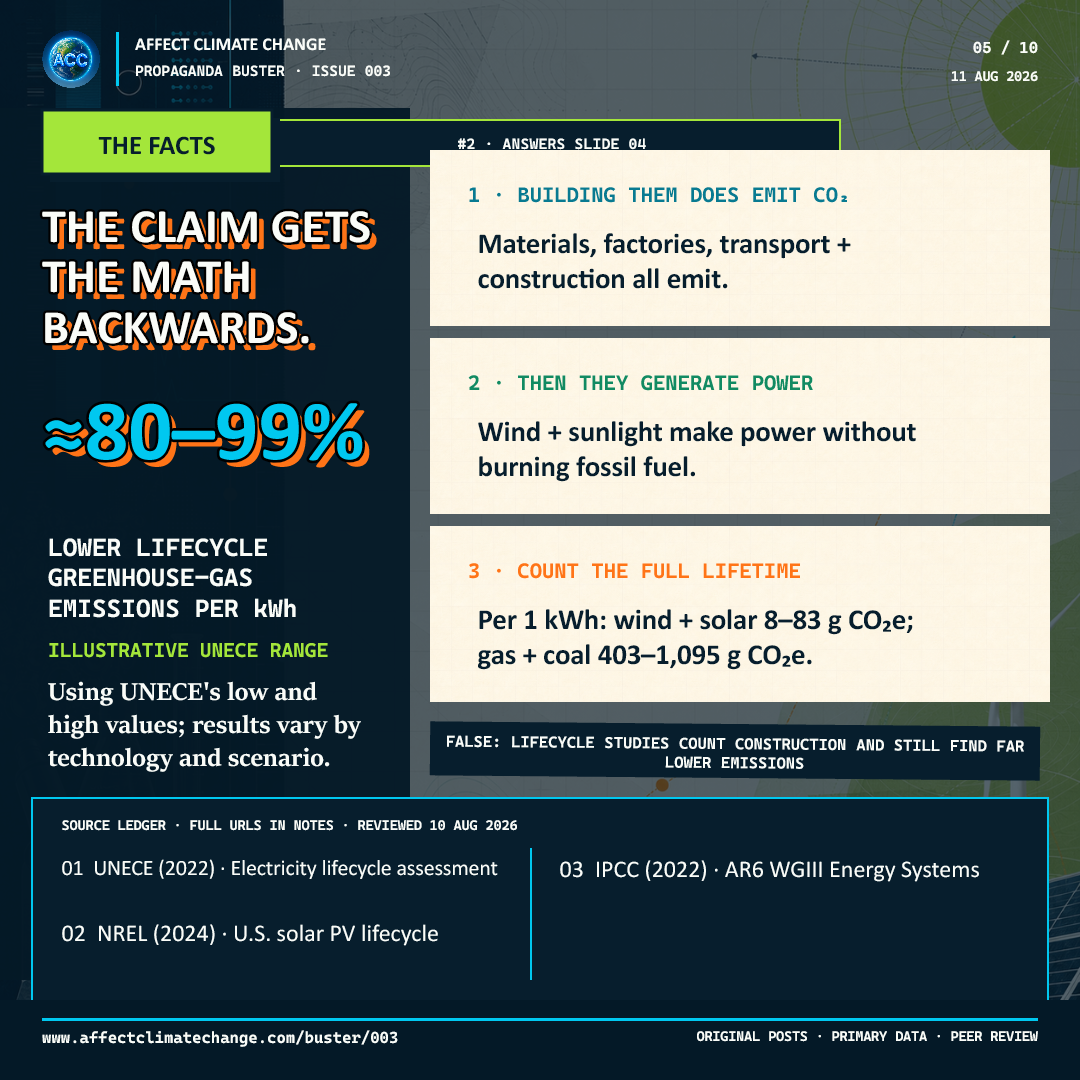
Building turbines and panels creates emissions. But wind and solar then generate electricity without burning fuel, while coal and gas keep emitting whenever fuel is burned. Lifecycle studies count construction and still find much lower emissions per kilowatt-hour.
- UNECE reports lifecycle emissions of 7.8–23 g CO2e/kWh for wind and 8–83 for solar PV, compared with 403–513 for natural gas combined cycle and 751–1,095 for coal.
- NREL's 2024 cradle-to-grave U.S. utility-scale solar assessment reports 10–36 g CO2e/kWh and a benchmark carbon payback time of 2.1 years.
- An NREL-led systematic wind review reports a harmonized range of 3–45 g CO2e/kWh and a median of 11.
- The 80–99% comparison shown in the social evidence slide is derived from UNECE's outer endpoints and is explicitly illustrative, not universal.
Evidence chain
Each source is dated and paired with the finding it supports. The original post establishes what was claimed; it does not decide the scientific verdict.
Life Cycle Assessment of Electricity Generation Options
Published / source period: 2022-03
United Nations Economic Commission for Europe · Counts infrastructure and supply chains and reports wind and solar lifecycle ranges far below natural gas and coal per kilowatt-hour.
Accessed August 10, 2026
An Updated Life Cycle Assessment of Utility-Scale Solar Photovoltaic Systems Installed in the United States
Published / source period: 2024-03
National Renewable Energy Laboratory · Reports cradle-to-grave U.S. utility-scale solar PV emissions of 10–36 g CO2e/kWh and a benchmark carbon payback time of 2.1 years.
Accessed August 10, 2026
Life Cycle Greenhouse Gas Emissions of Utility-Scale Wind Power: Systematic Review and Harmonization
Published / source period: 2012-04
Journal of Industrial Ecology / National Renewable Energy Laboratory · Reports harmonized wind lifecycle estimates of 3–45 g CO2e/kWh with a median of 11.
Accessed August 10, 2026
AR6 Working Group III Chapter 6: Energy Systems
Published / source period: 2022
Intergovernmental Panel on Climate Change · Assesses solar photovoltaic lifecycle emissions as far below fossil generation while explaining variation in manufacturing energy and displaced electricity.
Accessed August 10, 2026
What is true
Mining, manufacturing, transport, construction, maintenance, and retirement do create emissions. Results vary with technology, location, capacity factor, manufacturing energy, lifetime, recycling, study boundaries, and the grid electricity displaced. Those real differences do not support the absolute claim evaluated here.
Where the claim fails
The claim treats upfront construction emissions as though they exceed decades of avoided fuel combustion. Cradle-to-grave assessments include raw materials, manufacturing, transport, construction, maintenance, and end-of-life and still place wind and solar far below fossil generation per unit of electricity.
Limits and uncertainty
The approximately 80–99% lower reader-facing range is an illustrative envelope calculated from the outer UNECE lifecycle endpoints: 1 − (83/403) = 79.4% and 1 − (7.8/1,095) = 99.3%. It is not one universal estimate for every project or grid.
Assessment after the evidence
Building turbines and panels creates emissions. But wind and solar then generate electricity without burning fuel, while coal and gas keep emitting whenever fuel is burned. Lifecycle studies count construction and still find much lower emissions per kilowatt-hour.
How the framing works
Boundary distortion: upfront construction emissions are treated as if they outweigh decades of avoided fuel combustion even though lifecycle studies explicitly count both.
How scientists know
Lifecycle assessment adds emissions across the full system and divides them by lifetime electricity generation. Independent intergovernmental, national-laboratory, peer-reviewed, and IPCC sources reach the same broad comparison even though their exact ranges differ.
Editorial boundaries
ACC evaluates the claim. It does not infer intent, coordination, funding, deception, or control without direct evidence specific to that attribution.
The source presentation and reuse decision are documented here: Final limited-use review approved the recreated attributed-text treatment and the limited excerpt crop embedded in ACC's ten-slide edition; the complete native capture remains private research material.
Corrections and revision record
Corrections status: No change to the scientific verdict has been recorded.
0.1 · August 9, 2026
Initial editor-review candidate created from four native public claims, primary and peer-reviewed sources, explicit uncertainty, and a complete ten-slide social preview. No publication approval recorded.
0.2-r6 · August 11, 2026
Replaced the Arctic-ratio case with the wind-and-solar lifecycle-emissions claim, preserved the exact ‘no sharp acceleration’ wording, qualified the UNECE-derived 80–99% illustrative range, added the AR6 Working Group I Summary for Policymakers source, and integrated the final R6 slide renders. No publication approval recorded.
1.0 · August 11, 2026
Recorded final owner approval for the public website record and corrected larger-type R6 social edition after independent source, calculation, accessibility, limited-use, and editorial review. This local package does not itself deploy or post the issue.
1.1-r7 · August 11, 2026
Replaced the Issue 003 visual skin with owner-approved established ACC navy, orange, cyan, and lime R7 artwork while preserving the claims, evidence, verdicts, citations, and accessibility copy. This local package does not itself deploy the website or post the issue.